Note
Click here to download the full example code
Alesmodel: Plotting sections and maps.
import gempy as gp
import numpy as np
import matplotlib.pyplot as plt
import os
cwd = os.getcwd()
if 'examples' not in cwd:
    data_path = os.getcwd() + '/examples'
else:
    data_path = cwd + '/../..'

path_interf = data_path + "/data/input_data/AlesModel/2018_interf.csv"
path_orient = data_path + "/data/input_data/AlesModel/2018_orient_clust_n_init5_0.csv"
path_dem = data_path + "/data/input_data/AlesModel/_cropped_DEM_coarse.tif"
resolution = [100, 100, 100]
extent = np.array([729550.0, 751500.0, 1913500.0, 1923650.0, -1800.0, 800.0])
geo_model = gp.create_model('Alesmodel')
gp.init_data(geo_model, extent=extent, resolution=resolution,
             path_i=path_interf,
             path_o=path_orient)
Out:
Active grids: ['regular']

Alesmodel  2021-04-18 11:31
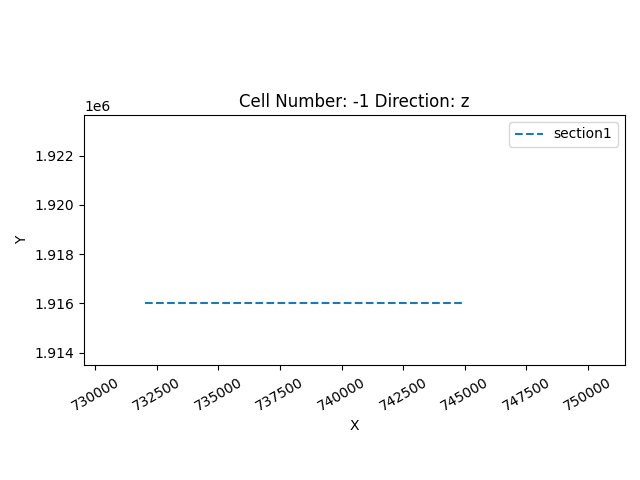
sdict = {'section1': ([732000, 1916000], [745000, 1916000], [200, 150])}
geo_model.set_section_grid(sdict)
Out:
Active grids: ['regular' 'sections']
sorting of lithologies
gp.map_stack_to_surfaces(geo_model, {'fault_left': ('fault_left'),
                                     'fault_right': ('fault_right'),
                                     'fault_lr': ('fault_lr'),
                                     'Trias_Series': ('TRIAS', 'LIAS'),
                                     'Carbon_Series': ('CARBO'),
                                     'Basement_Series': ('basement')}, remove_unused_series=True)
colordict = {'LIAS': '#015482', 'TRIAS': '#9f0052', 'CARBO': '#ffbe00', 'basement': '#728f02',
             'fault_left': '#2a2a2a', 'fault_right': '#545454', 'fault_lr': '#a5a391'}
geo_model.surfaces.colors.change_colors(colordict)
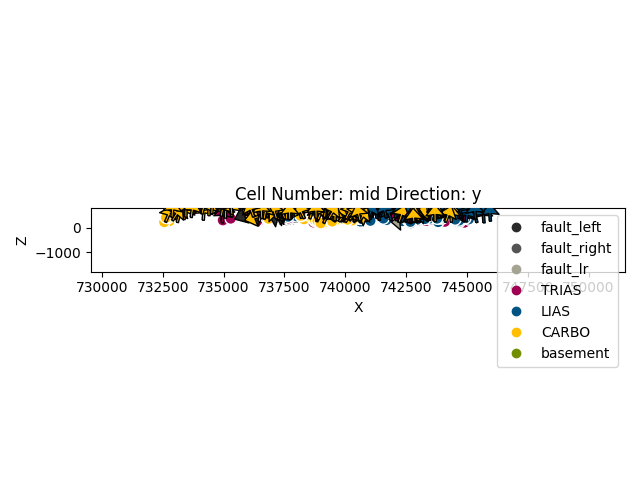
a = gp.plot_2d(geo_model, direction='y')
gp.plot.plot_section_traces(geo_model)
Out:
<gempy.plot.visualization_2d.Plot2D object at 0x7fcb8c099610>
Faults
geo_model.set_is_fault(['fault_right', 'fault_left', 'fault_lr'], change_color=True)
Out:
Fault colors changed. If you do not like this behavior, set change_color to False.
gp.set_interpolator(geo_model,
                    output=['geology'], compile_theano=True,
                    theano_optimizer='fast_run', dtype='float64',
                    verbose=[])
Out:
Setting kriging parameters to their default values.
Compiling theano function...
Level of Optimization:  fast_run
Device:  cpu
Precision:  float64
Number of faults:  3
Compilation Done!
Kriging values:
                              values
range                      24322.52
$C_o$                   14085357.14
drift equations  [3, 3, 3, 3, 3, 3]

<gempy.core.interpolator.InterpolatorModel object at 0x7fccb8a38160>
Topography
geo_model.set_topography(source='gdal', filepath=path_dem)
Out:
Cropped raster to geo_model.grid.extent.
depending on the size of the raster, this can take a while...
storing converted file...
Active grids: ['regular' 'topography' 'sections']

Grid Object. Values:
array([[ 7.29659750e+05,  1.91355075e+06, -1.78700000e+03],
       [ 7.29659750e+05,  1.91355075e+06, -1.76100000e+03],
       [ 7.29659750e+05,  1.91355075e+06, -1.73500000e+03],
       ...,
       [ 7.45000000e+05,  1.91600000e+06,  7.65100671e+02],
       [ 7.45000000e+05,  1.91600000e+06,  7.82550336e+02],
       [ 7.45000000e+05,  1.91600000e+06,  8.00000000e+02]])
_ = gp.compute_model(geo_model, compute_mesh=True, compute_mesh_options={'rescale': False})
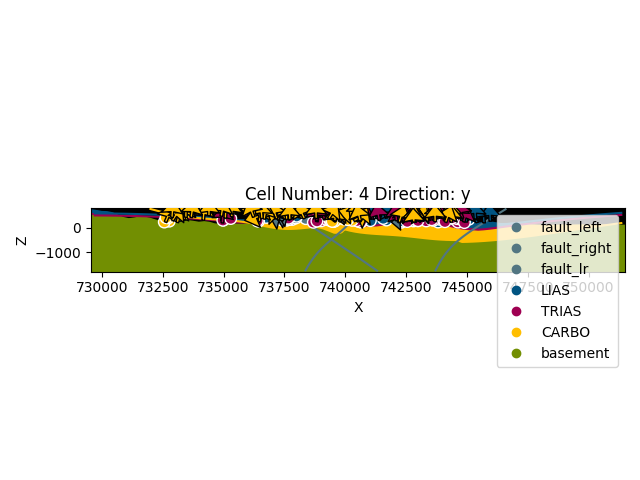
gp.plot_2d(geo_model, cell_number=[4], direction=['y'], show_topography=True,
           show_data=True)
Out:
<gempy.plot.visualization_2d.Plot2D object at 0x7fcc6bb90a60>
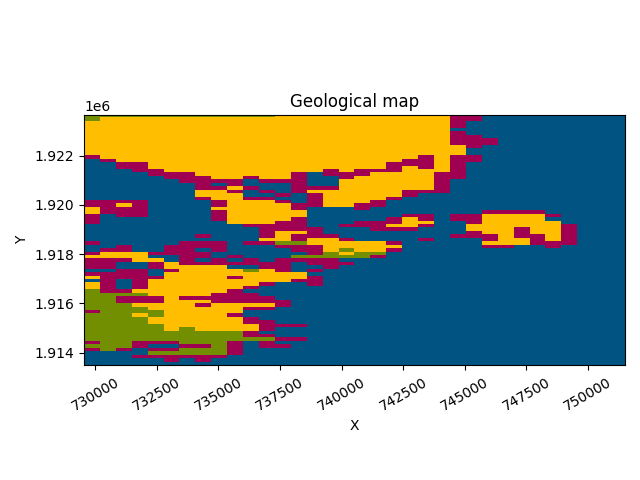
gp.plot_2d(geo_model, section_names=['topography'], show_data=False,
           show_boundaries=False)
Out:
<gempy.plot.visualization_2d.Plot2D object at 0x7fcc2a5945e0>
sphinx_gallery_thumbnail_number = 5
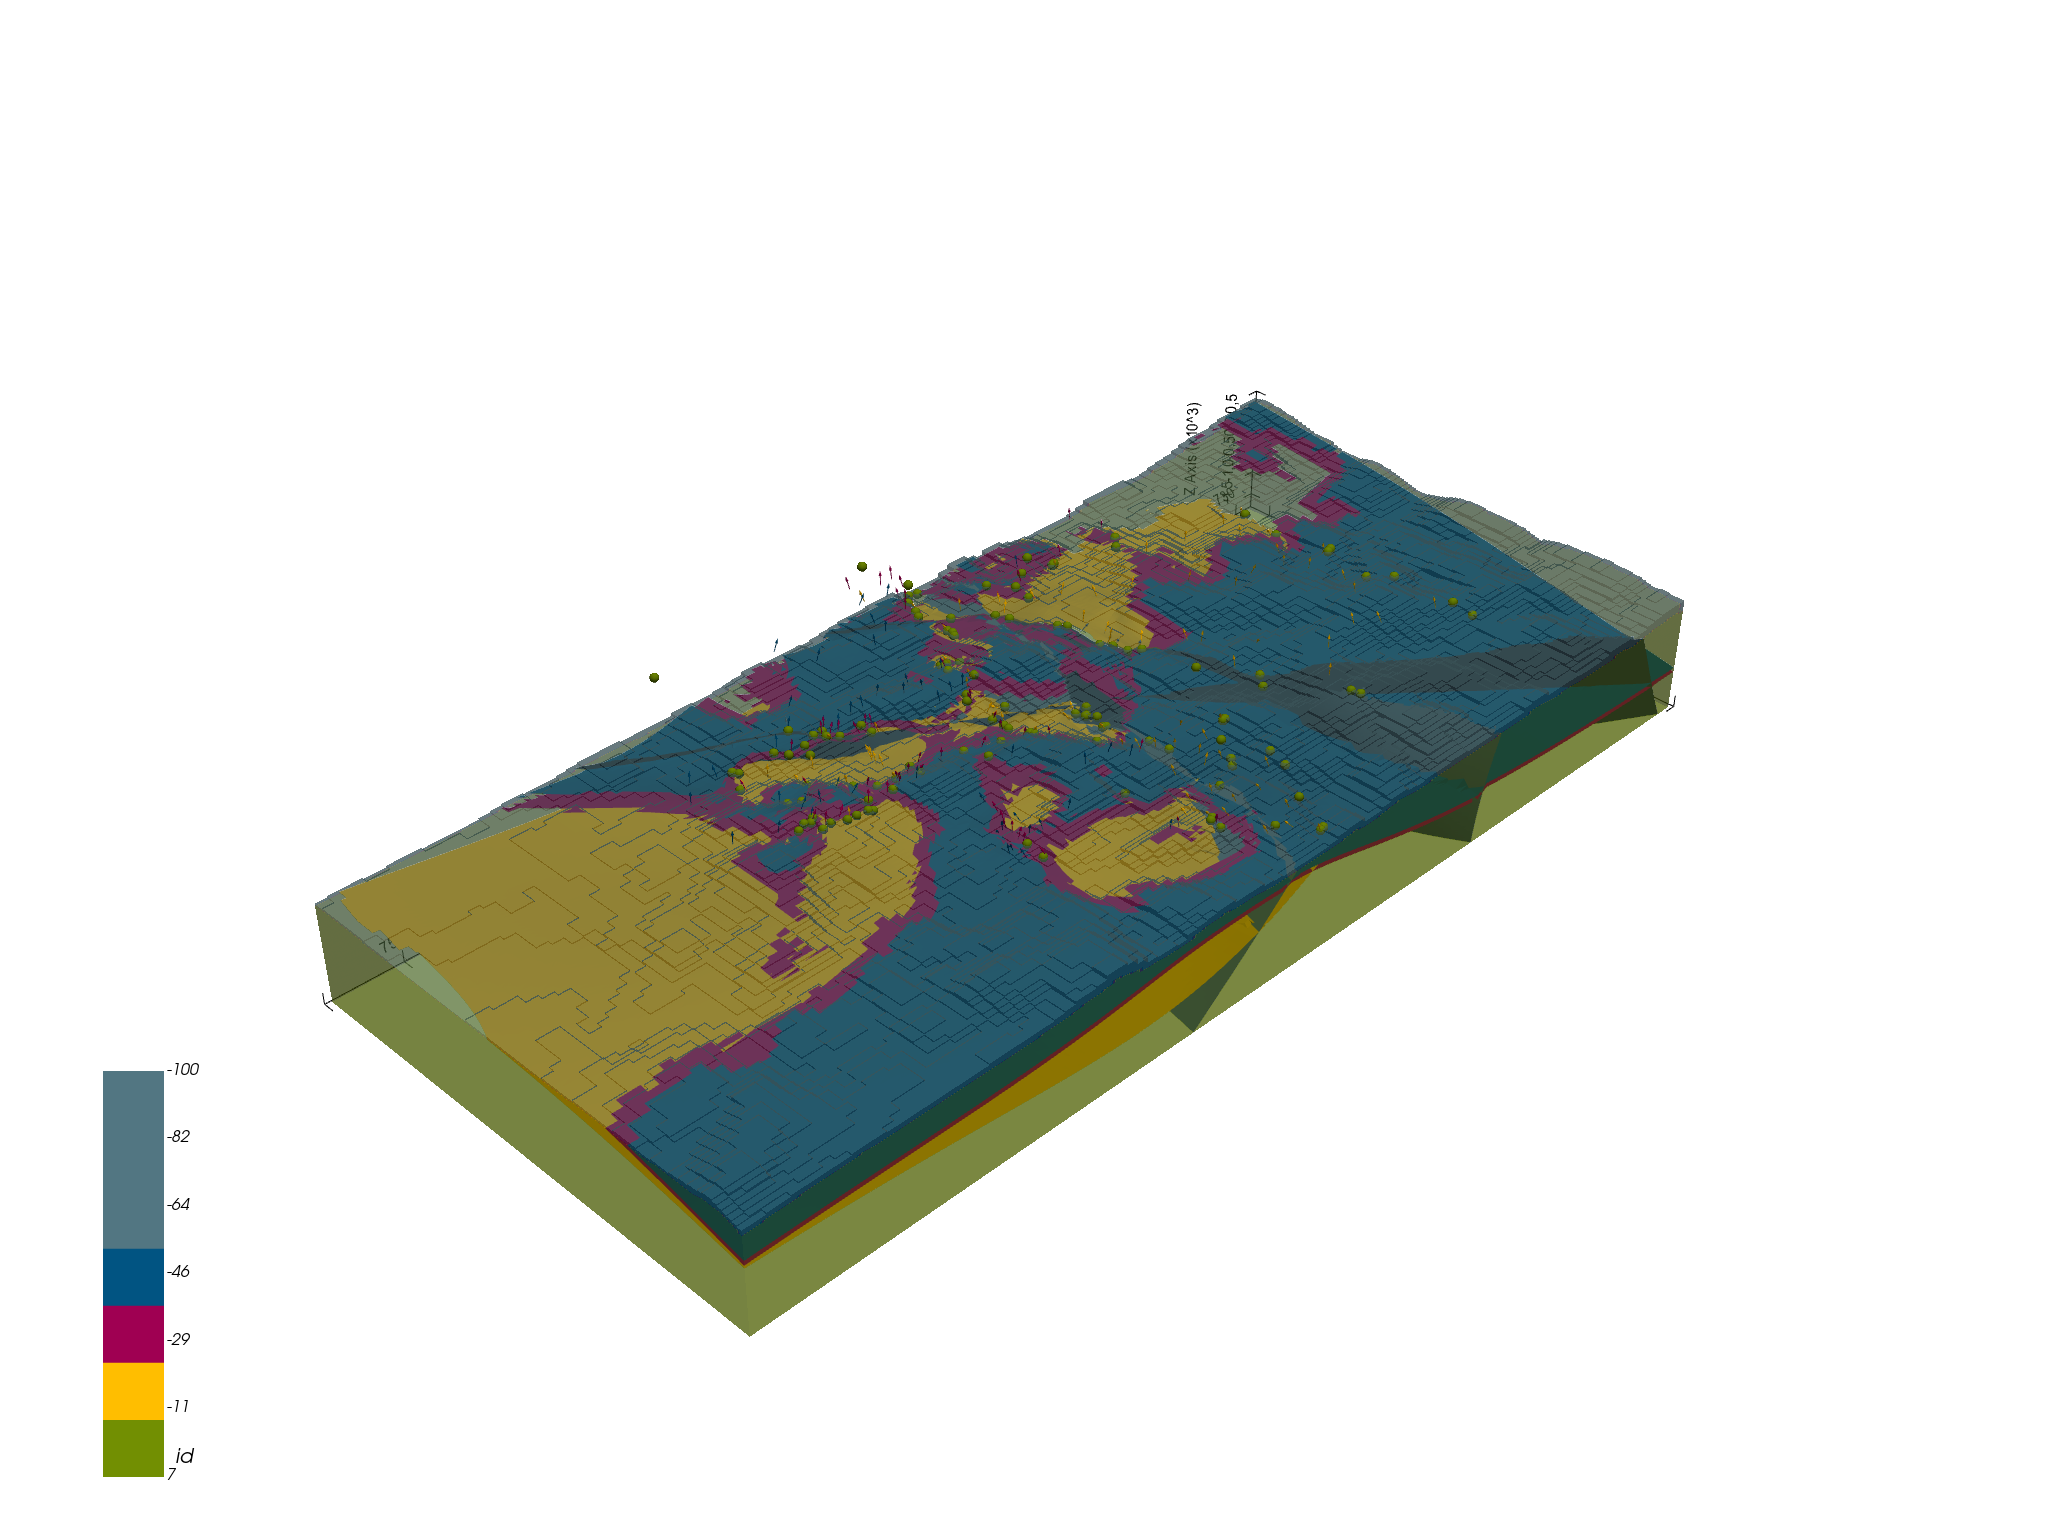
Out:
<gempy.plot.vista.GemPyToVista object at 0x7fcb8ad989d0>
np.save(‘Ales_vert3’, geo_model.solutions.vertices) np.save(‘Ales_edges3’, geo_model.solutions.edges)
gp.plot.plot_ar(geo_model)
gp.save_model(geo_model)
Out:
True
Total running time of the script: ( 2 minutes 3.841 seconds)
