Note
Click here to download the full example code
Perth basin.
import os

# Importing GemPy
import gempy as gp

# Importing auxiliary libraries
import matplotlib
matplotlib.rcParams['figure.figsize'] = (20.0, 10.0)
os.environ["THEANO_FLAGS"] = "mode=FAST_RUN,device=cuda"
data_path = 'https://raw.githubusercontent.com/cgre-aachen/gempy_data/master/'
geo_model = gp.create_model('Perth_Basin')
gp.init_data(geo_model,
             extent=[337000, 400000, 6640000, 6710000, -18000, 1000],
             resolution=[100, 100, 100],
             path_i=data_path + "/data/input_data/Perth_basin/Paper_GU2F_sc_faults_topo_Points.csv",
             path_o=data_path + "/data/input_data/Perth_basin/Paper_GU2F_sc_faults_topo_Foliations.csv")
Out:
Active grids: ['regular']

Perth_Basin  2021-04-18 11:38
del_surfaces = ['Cadda', 'Woodada_Kockatea', 'Cattamarra']
geo_model.delete_surfaces(del_surfaces, remove_data=True)
%debug
gp.map_stack_to_surfaces(geo_model,
                          {"fault_Abrolhos_Transfer": ["Abrolhos_Transfer"],
                           "fault_Coomallo": ["Coomallo"],
                           "fault_Eneabba_South": ["Eneabba_South"],
                           "fault_Hypo_fault_W": ["Hypo_fault_W"],
                           "fault_Hypo_fault_E": ["Hypo_fault_E"],
                           "fault_Urella_North": ["Urella_North"],
                           "fault_Urella_South": ["Urella_South"],
                           "fault_Darling": ["Darling"],
                           "Sedimentary_Series": ['Cretaceous',
                                                  'Yarragadee',
                                                  'Eneabba',
                                                  'Lesueur',
                                                  'Permian']
                           })
order_series = ["fault_Abrolhos_Transfer",
                "fault_Coomallo",
                "fault_Eneabba_South",
                "fault_Hypo_fault_W",
                "fault_Hypo_fault_E",
                "fault_Urella_North",
                "fault_Darling",
                "fault_Urella_South",
                "Sedimentary_Series", 'Basement']

geo_model.reorder_series(order_series)
Drop input data from the deleted series:
geo_model.surface_points.df.dropna(inplace=True)
geo_model.orientations.df.dropna(inplace=True)
Select which series are faults
geo_model.set_is_fault(["fault_Abrolhos_Transfer",
                        "fault_Coomallo",
                        "fault_Eneabba_South",
                        "fault_Hypo_fault_W",
                        "fault_Hypo_fault_E",
                        "fault_Urella_North",
                        "fault_Darling",
                        "fault_Urella_South"])
Out:
Fault colors changed. If you do not like this behavior, set change_color to False.
Fault Network
Out:
array([[False, False, False, False, False, False, False, False,  True,
         True],
       [False, False, False, False, False, False, False, False,  True,
         True],
       [False, False, False, False, False, False, False, False,  True,
         True],
       [False, False, False, False, False, False, False, False,  True,
         True],
       [False, False, False, False, False, False, False, False,  True,
         True],
       [False, False, False, False, False, False, False, False,  True,
         True],
       [False, False, False, False, False, False, False, False,  True,
         True],
       [False, False, False, False, False, False, False, False,  True,
         True],
       [False, False, False, False, False, False, False, False, False,
        False],
       [False, False, False, False, False, False, False, False, False,
        False]])
%matplotlib inline
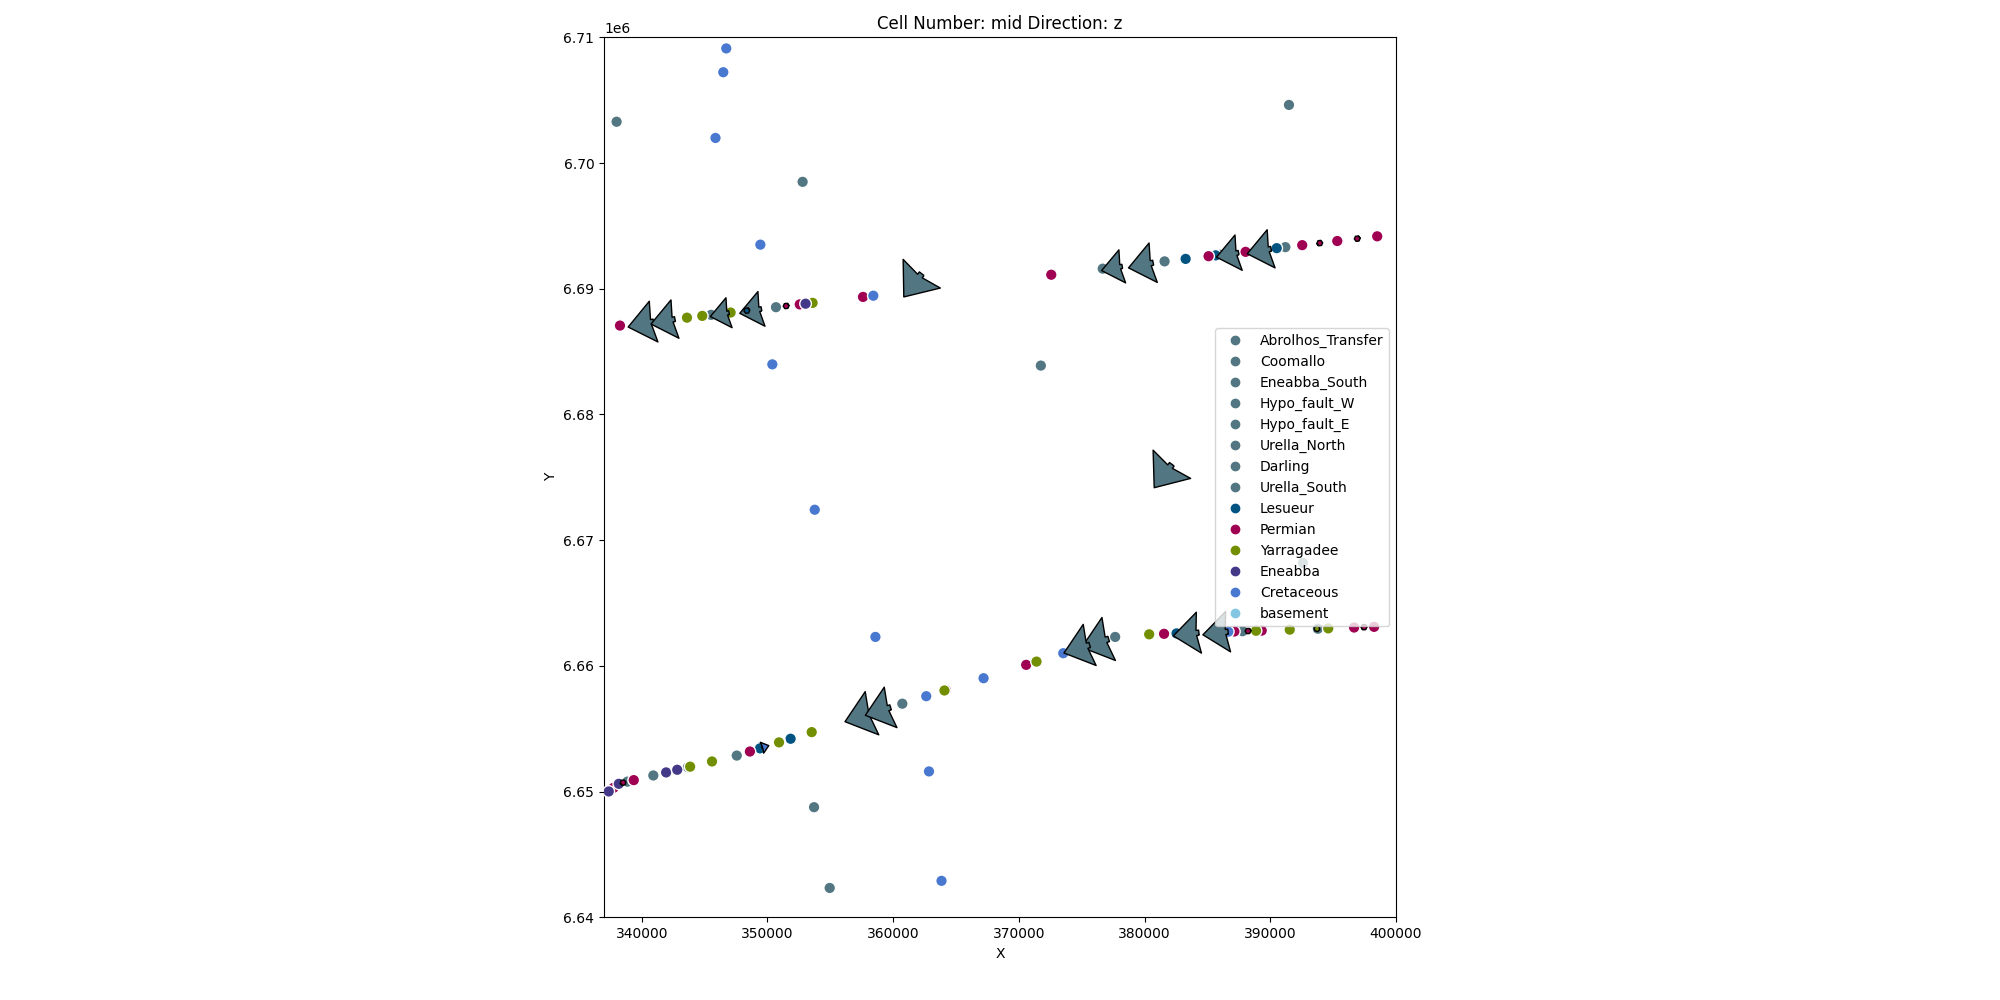
gp.plot_2d(geo_model, direction=['z'])
Out:
<gempy.plot.visualization_2d.Plot2D object at 0x7fcc47746910>
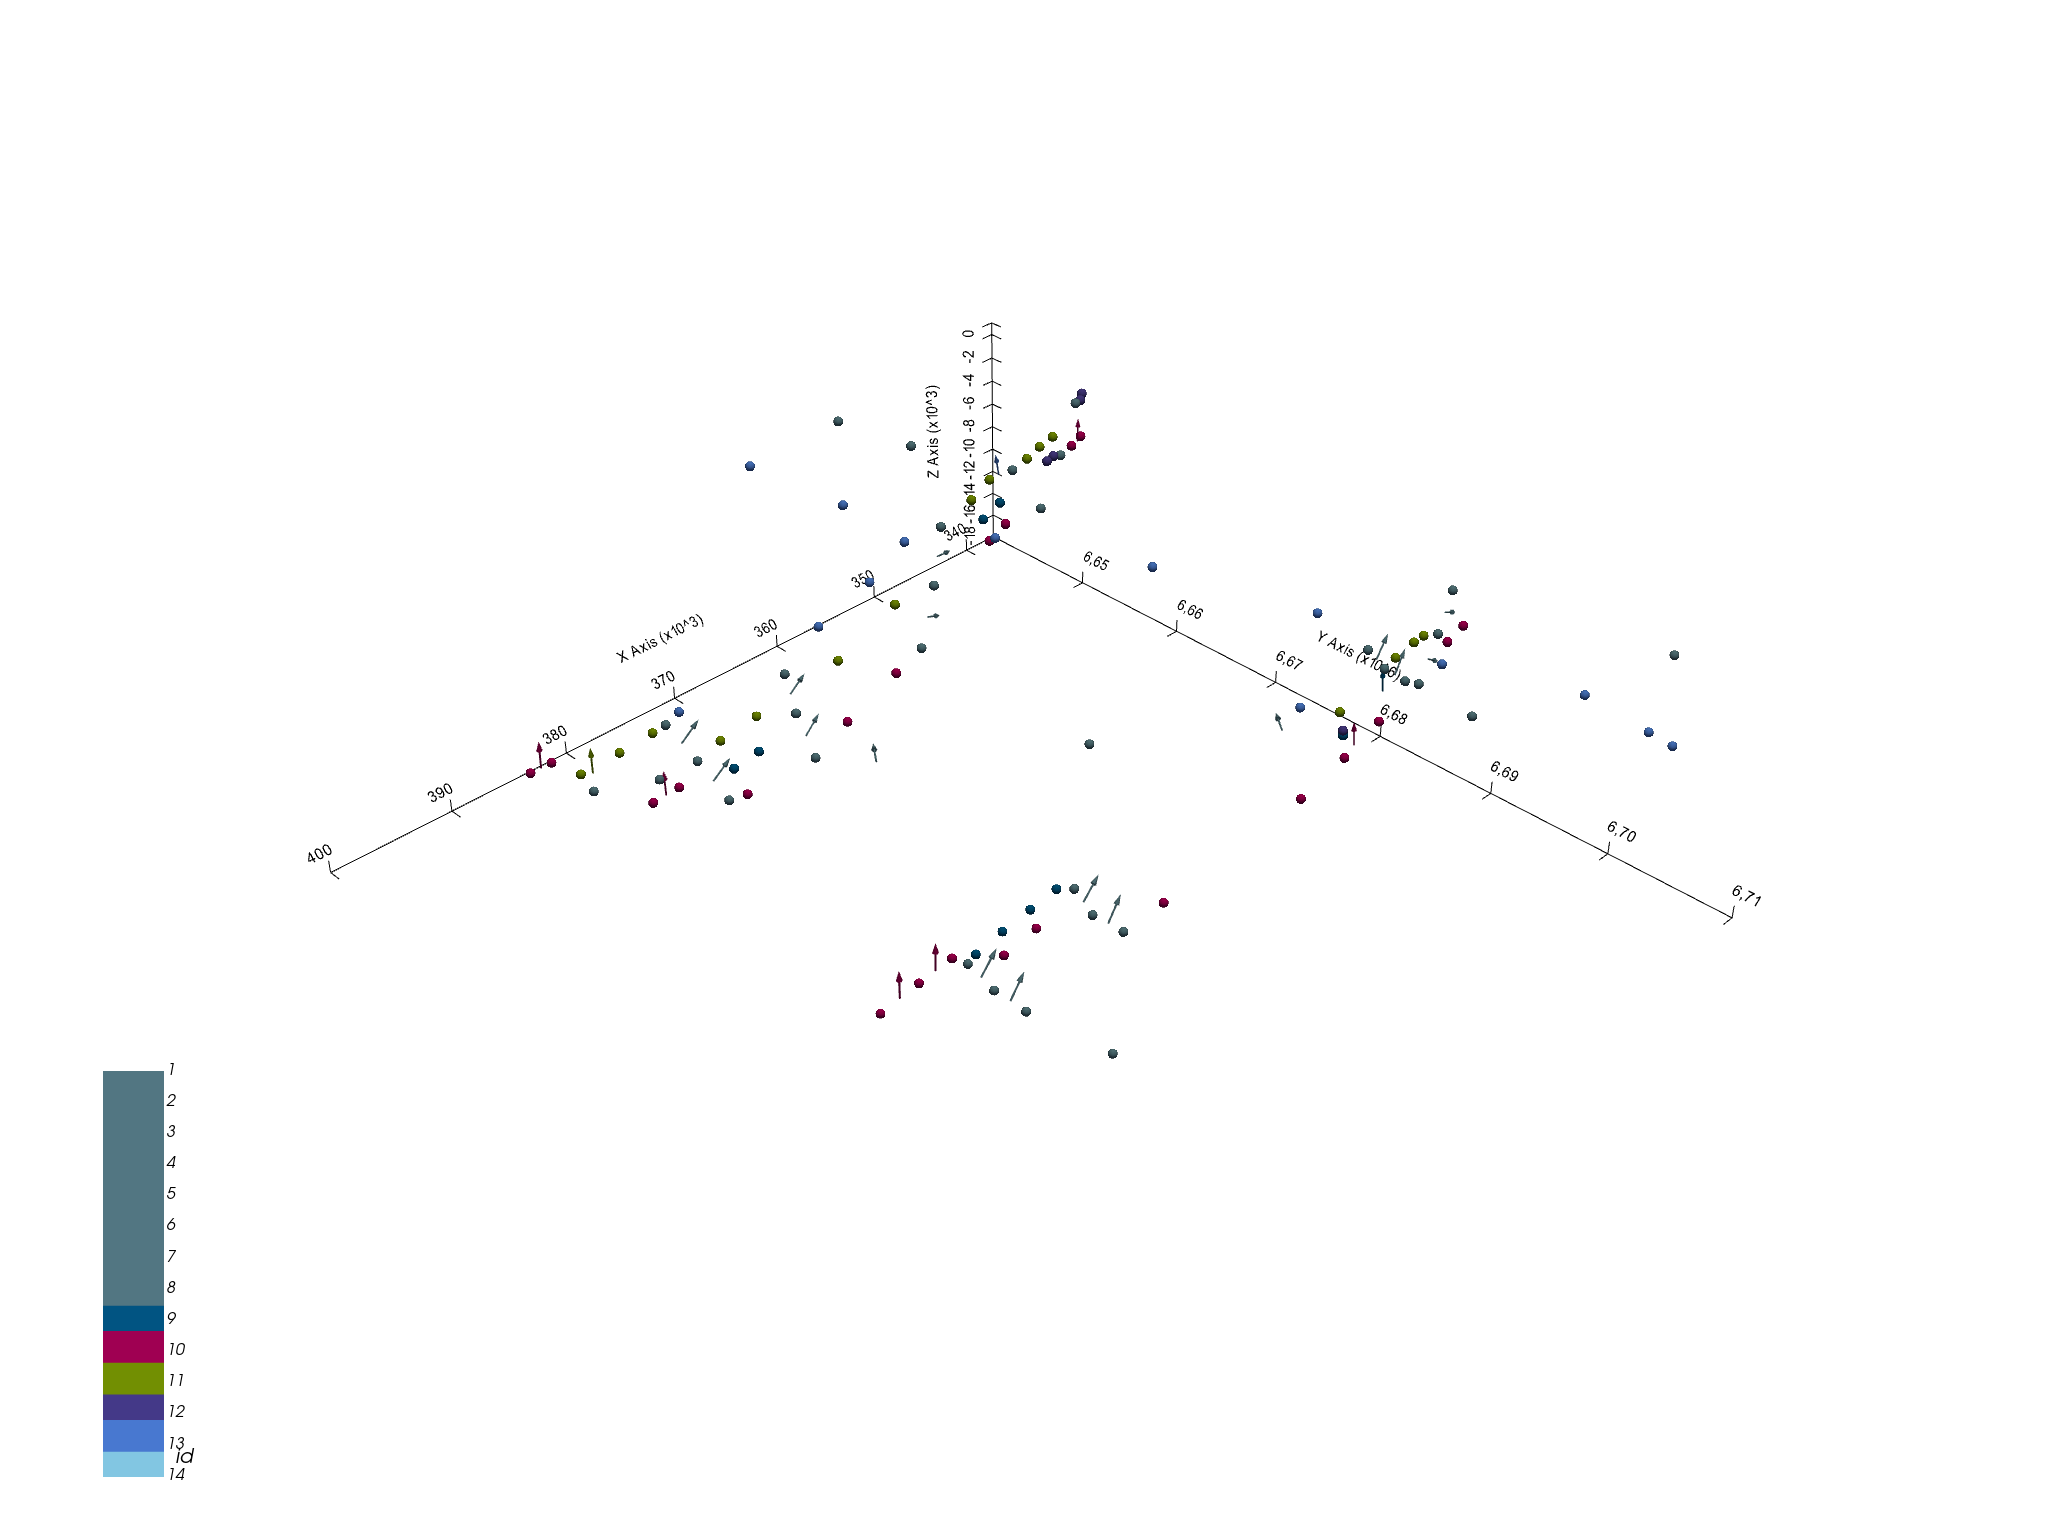
geo_model.set_topography(source='random')
Out:
[-2800.  1000.]
Active grids: ['regular' 'topography']

Grid Object. Values:
array([[ 3.37315000e+05,  6.64035000e+06, -1.79050000e+04],
       [ 3.37315000e+05,  6.64035000e+06, -1.77150000e+04],
       [ 3.37315000e+05,  6.64035000e+06, -1.75250000e+04],
       ...,
       [ 4.00000000e+05,  6.70858586e+06, -1.27047172e+03],
       [ 4.00000000e+05,  6.70929293e+06, -1.36072471e+03],
       [ 4.00000000e+05,  6.71000000e+06, -1.50378496e+03]])
Out:
<gempy.plot.vista.GemPyToVista object at 0x7fcc2a5b8a30>
interp_data = gp.set_interpolator(geo_model,
                                  compile_theano=True,
                                  theano_optimizer='fast_run', gradient=False,
                                  dtype='float32')
Out:
Setting kriging parameters to their default values.
Compiling theano function...
Level of Optimization:  fast_run
Device:  cpu
Precision:  float32
Number of faults:  8
Compilation Done!
Kriging values:
                                          values
range                                  96072.89
$C_o$                              219761904.76
drift equations  [3, 3, 3, 3, 3, 3, 3, 3, 3, 3]
Out:
Lithology ids
  [14.       14.       14.       ... 14.       13.035703 13.      ]
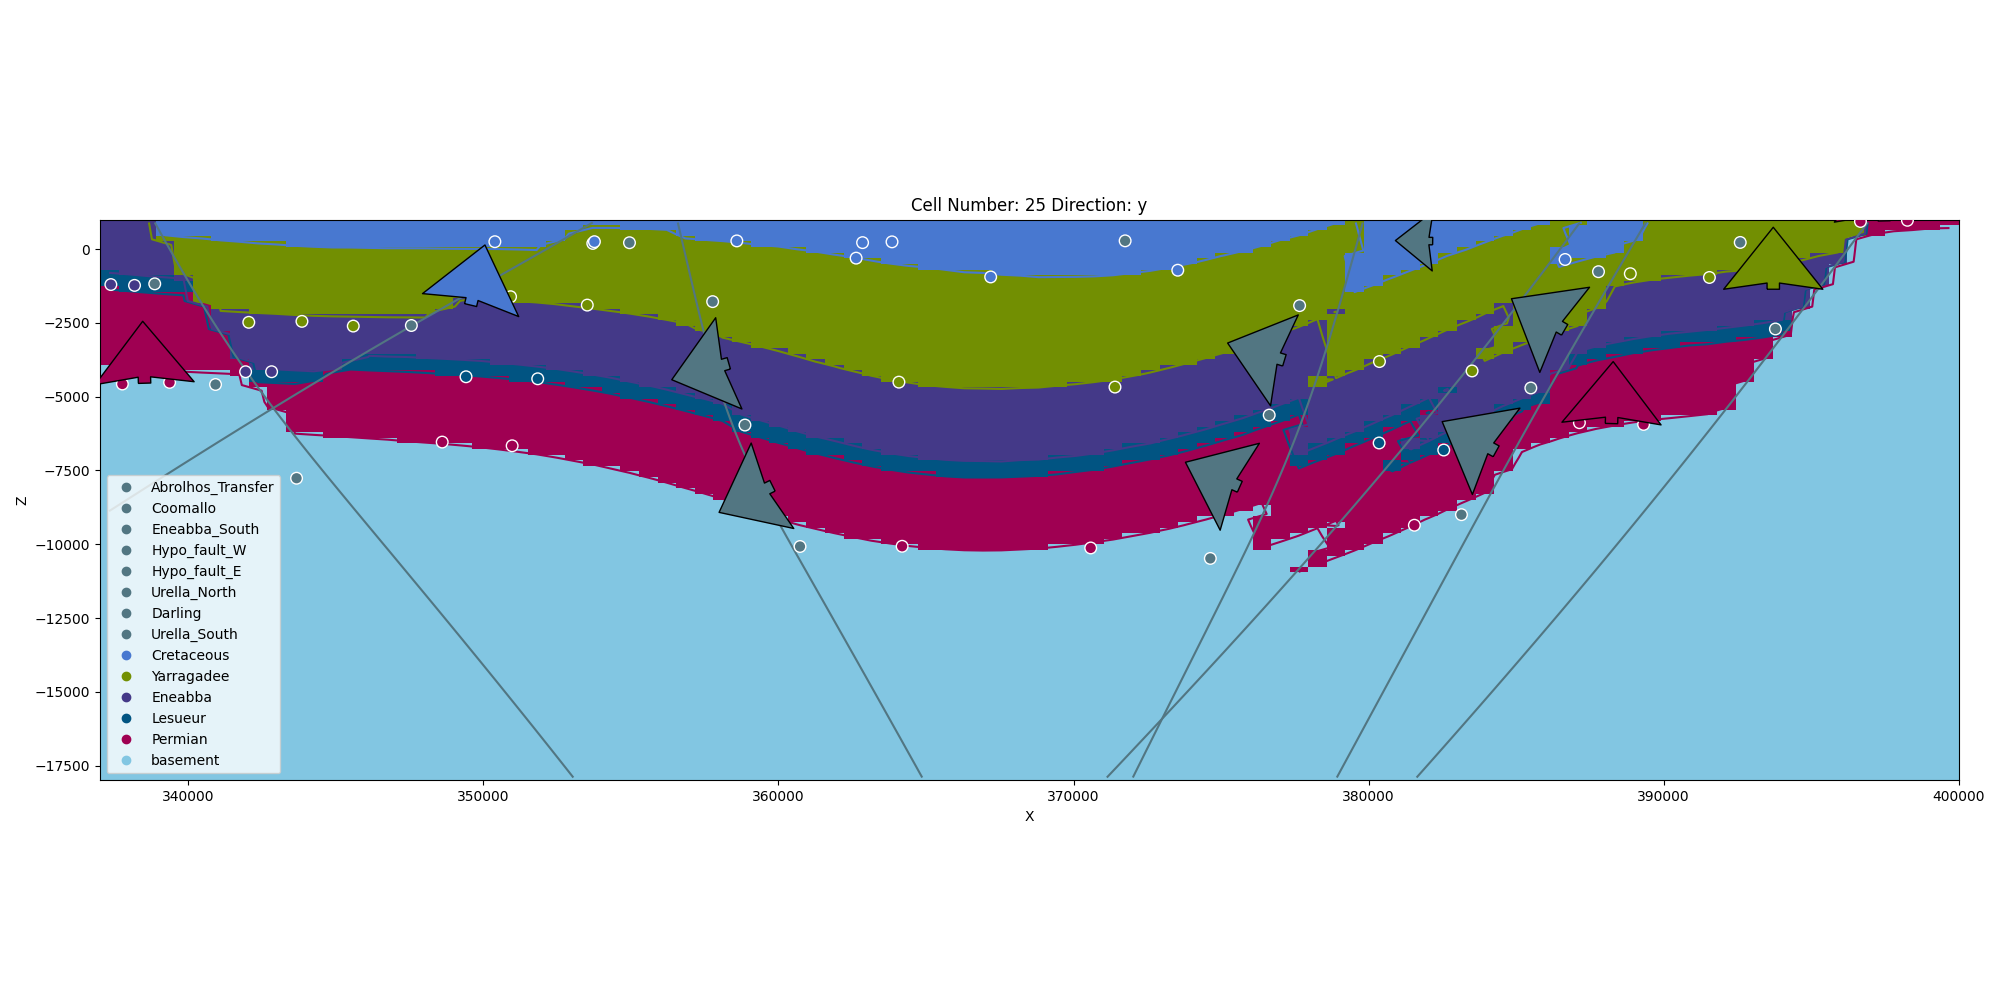
gp.plot_2d(geo_model, cell_number=[25])
Out:
<gempy.plot.visualization_2d.Plot2D object at 0x7fcc2a5b8a30>
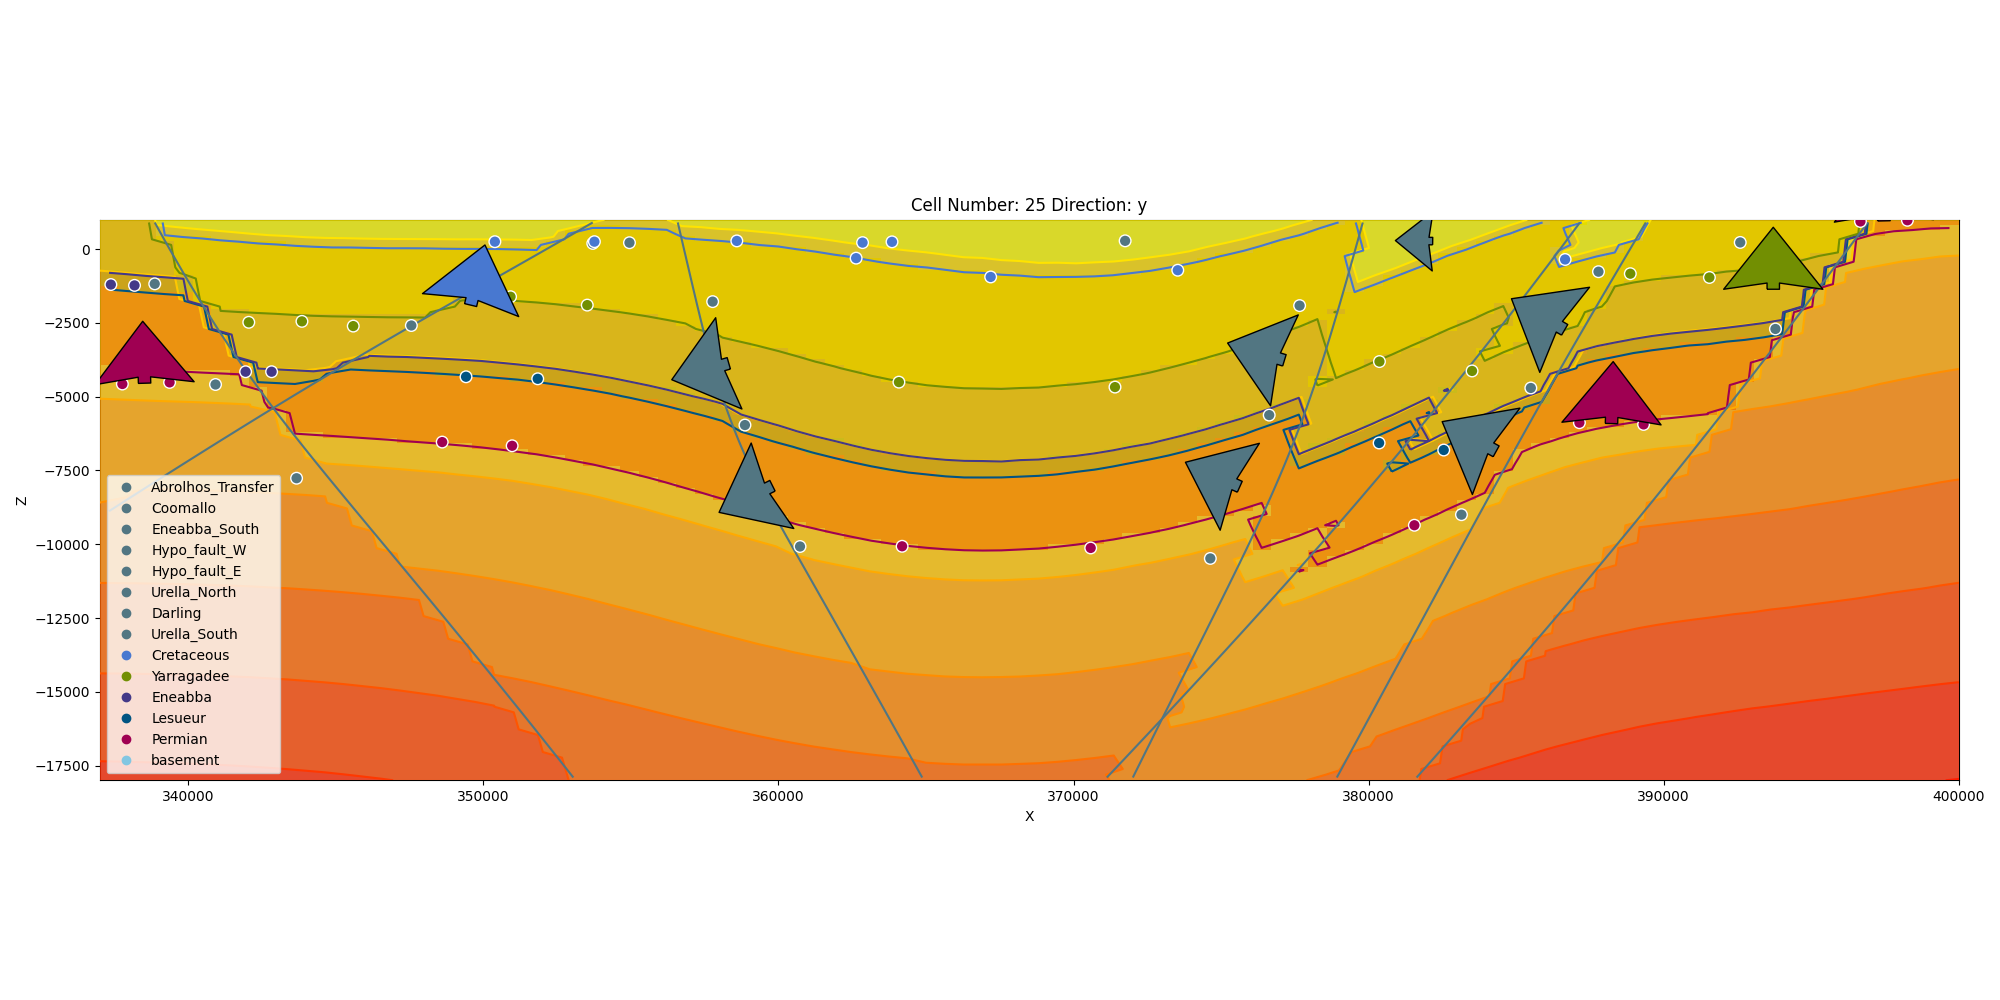
gp.plot_2d(geo_model, cell_number=[25], series_n=-1, show_scalar=True)
Out:
<gempy.plot.visualization_2d.Plot2D object at 0x7fcc465b2a00>
gp.plot_2d(geo_model, cell_number=[12], direction=["y"], show_data=True, show_topography=True)
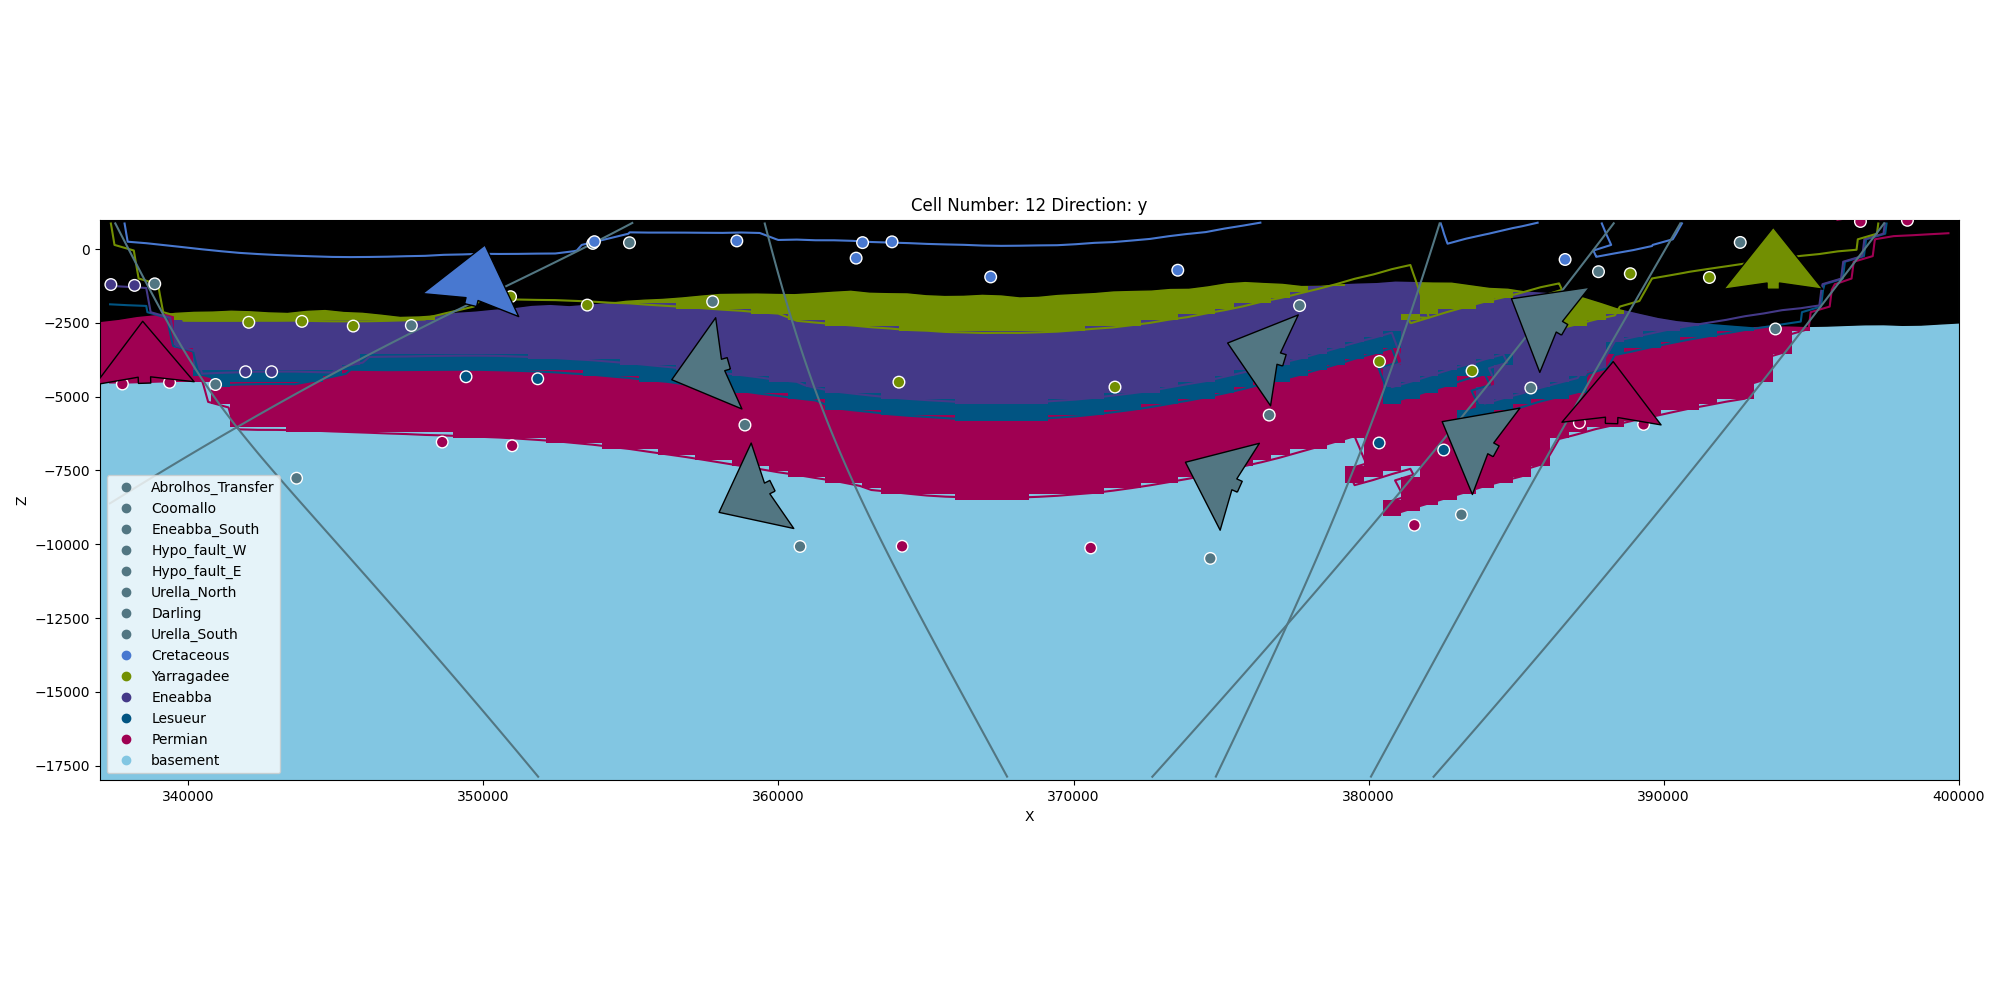
Out:
<gempy.plot.visualization_2d.Plot2D object at 0x7fcb8b4b8670>
sphinx_gallery_thumbnail_number = 6
gp.plot_3d(geo_model, show_topography=True)
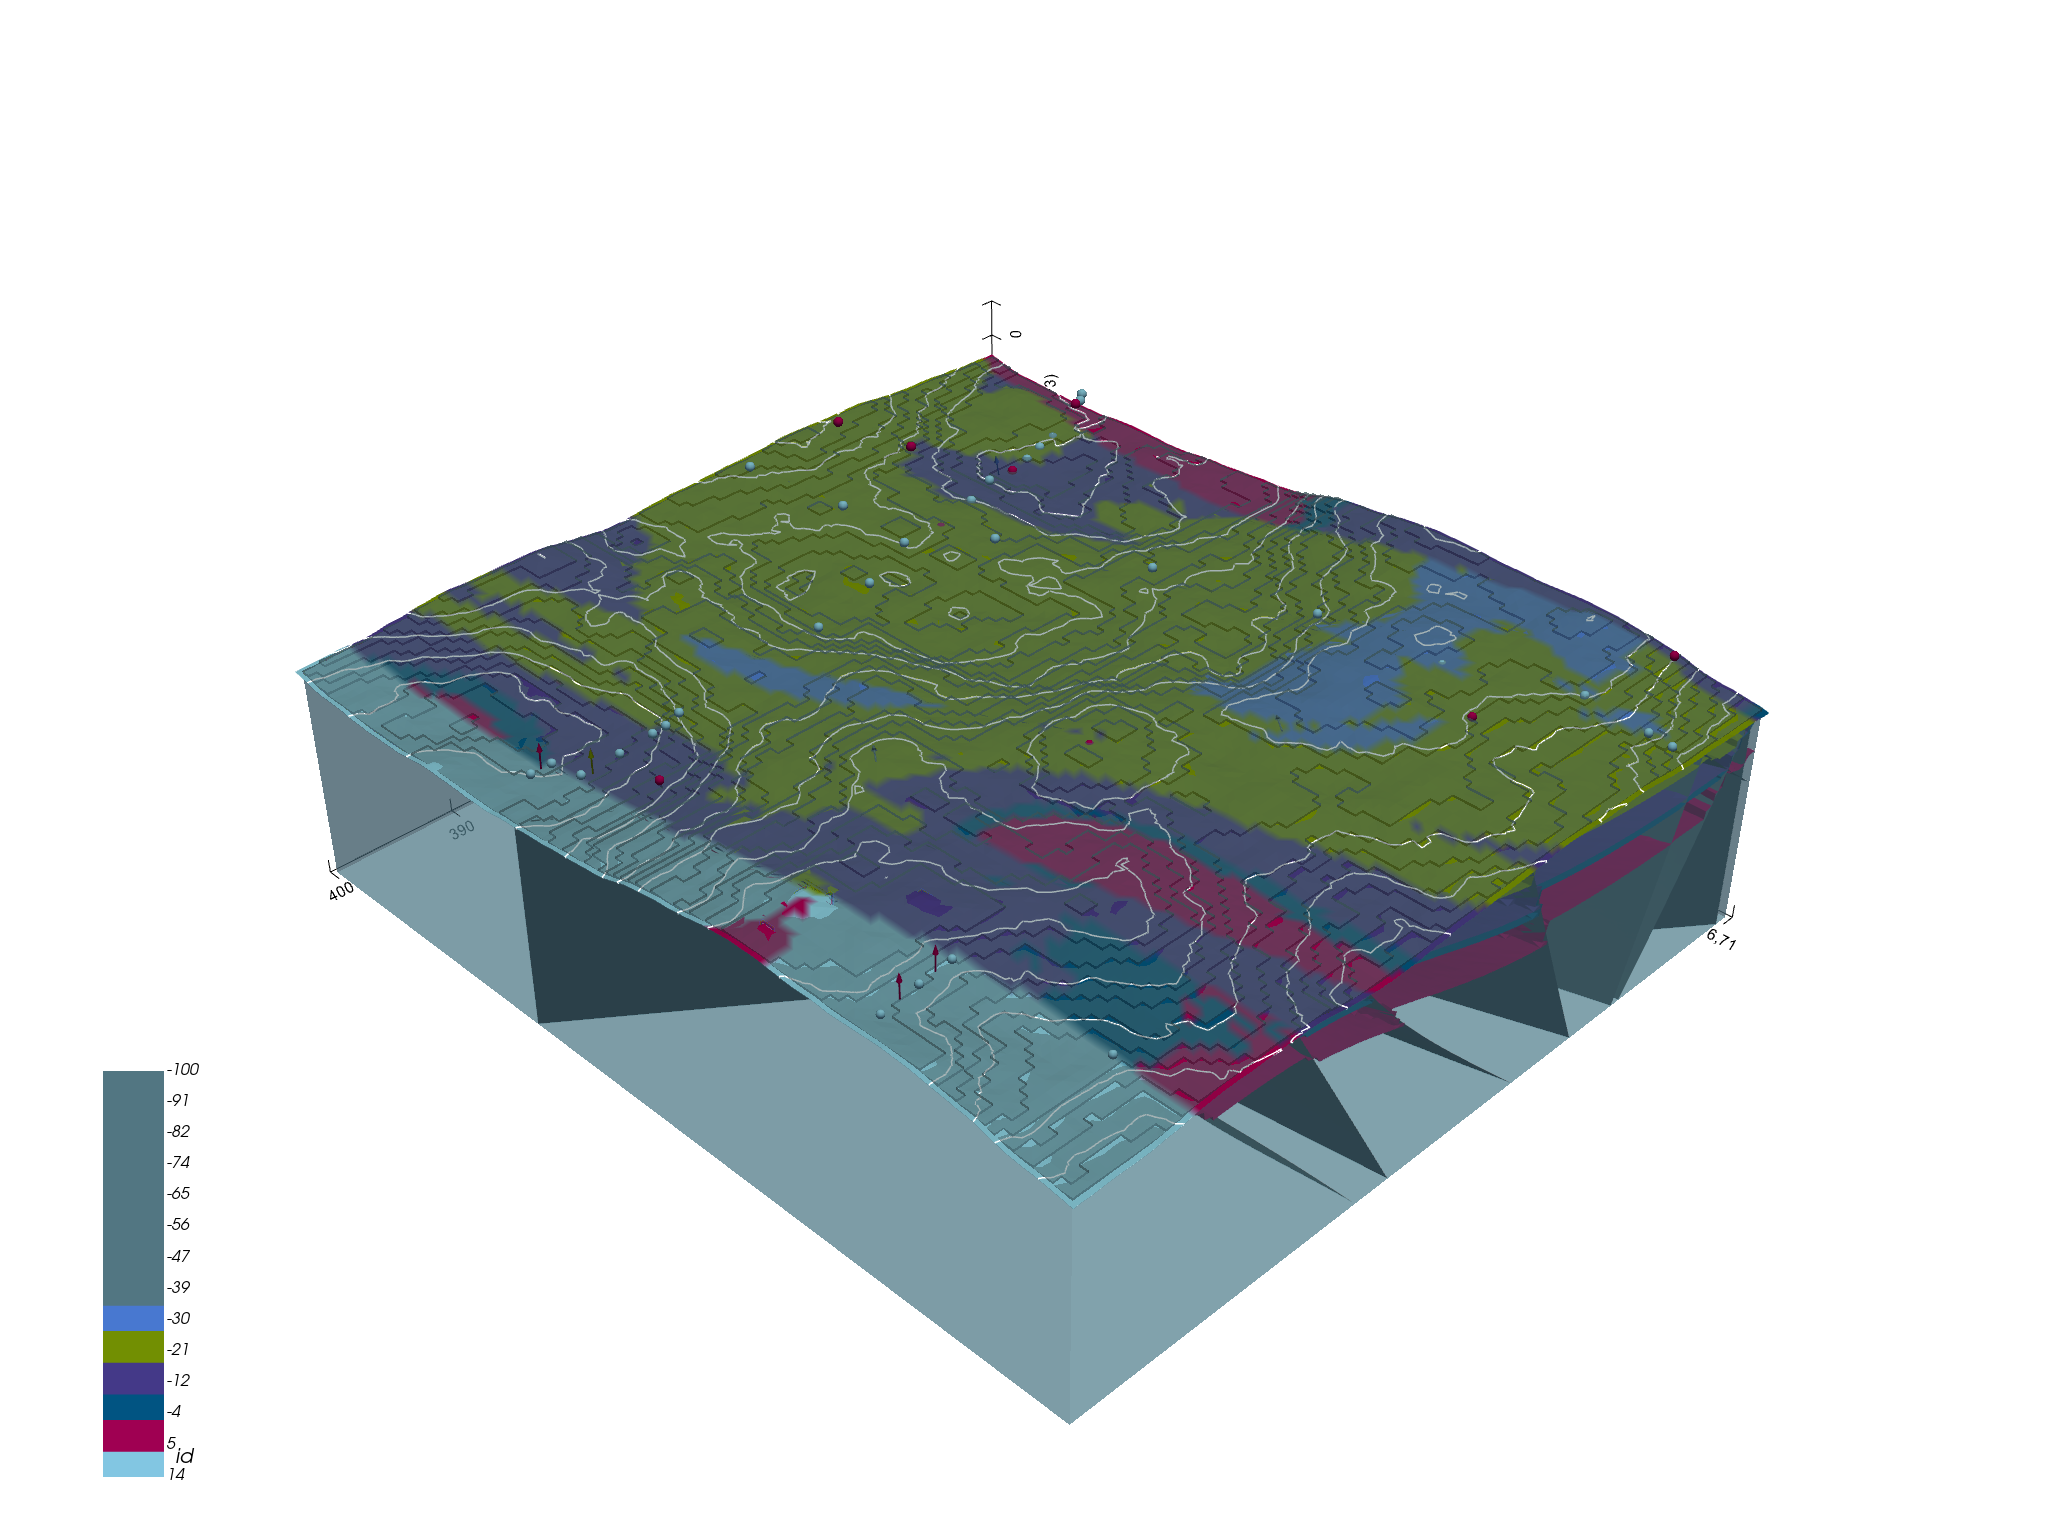
Out:
<gempy.plot.vista.GemPyToVista object at 0x7fcb8b7d3640>
Times
Fast run
1M voxels:
CPU: intel® Core™ i7-7700HQ CPU @ 2.80GHz × 8 15 s ± 1.02 s per loop (mean ± std. dev. of 7 runs, 1 loop each)
GPU (4gb) not enough memmory
Ceres 1M voxels 2080 851 ms
250k voxels
GPU 1050Ti: 3.11 s ± 11.8 ms per loop (mean ± std. dev. of 7 runs, 1 loop each)
CPU: intel® Core™ i7-7700HQ CPU @ 2.80GHz × 8 2.27 s ± 47.3 ms
Fast Compile
250k voxels
GPU 1050Ti: 3.7 s ± 11.8 ms per loop (mean ± std. dev. of 7 runs, 1 loop each)
CPU: intel® Core™ i7-7700HQ CPU @ 2.80GHz × 8 14.2 s ± 51.1 ms per loop (mean ± std. dev. of 7 runs, 1 loop each)
%%timeit gp.compute_model(geo_model)
ver = np.load(‘ver.npy’) sim = np.load(‘sim.npy’) lith_block = np.load(‘lith.npy’)
gp.save_model(geo_model)
Out:
True
Total running time of the script: ( 1 minutes 0.762 seconds)
