Note

Click here to download the full example code

GemPy - Subsurface Link

import pooch
import numpy as np
import pandas as pd

import subsurface as sb
from subsurface.reader import read_netcdf

data_url = "https://raw.githubusercontent.com/softwareunderground/subsurface/t21-main/examples/tutorials/wells_unstructured.nc"

data_hash = '05198041f2bffcc03d138f7f2b1802657228725c4a895d819d4f5fbc0e9978ca'
borehole_unstructured_data_file = pooch.retrieve(url=data_url,
                                                 known_hash=data_hash)

unstruct = read_netcdf.read_unstruct(borehole_unstructured_data_file)
unstruct

Out:

<xarray.Dataset>
Dimensions:       (XYZ: 3, cell: 3283, cell_attr: 1, nodes: 2, points: 3350, vertex_attr: 0)
Coordinates:
  * points        (points) int64 0 1 2 3 4 5 6 ... 3344 3345 3346 3347 3348 3349
  * XYZ           (XYZ) object 'X' 'Y' 'Z'
  * cell_attr     (cell_attr) object 'lith_log'
  * vertex_attr   (vertex_attr) int64
    UWI           (cell) object ...
    Depth         (cell) float64 ...
Dimensions without coordinates: cell, nodes
Data variables:
    vertex        (points, XYZ) float64 2.796e+05 3.943e+06 ... -3.33e+03
    cells         (cell, nodes) int64 ...
    cell_attrs    (cell, cell_attr) int64 ...
    vertex_attrs  (points, vertex_attr) float64 ...
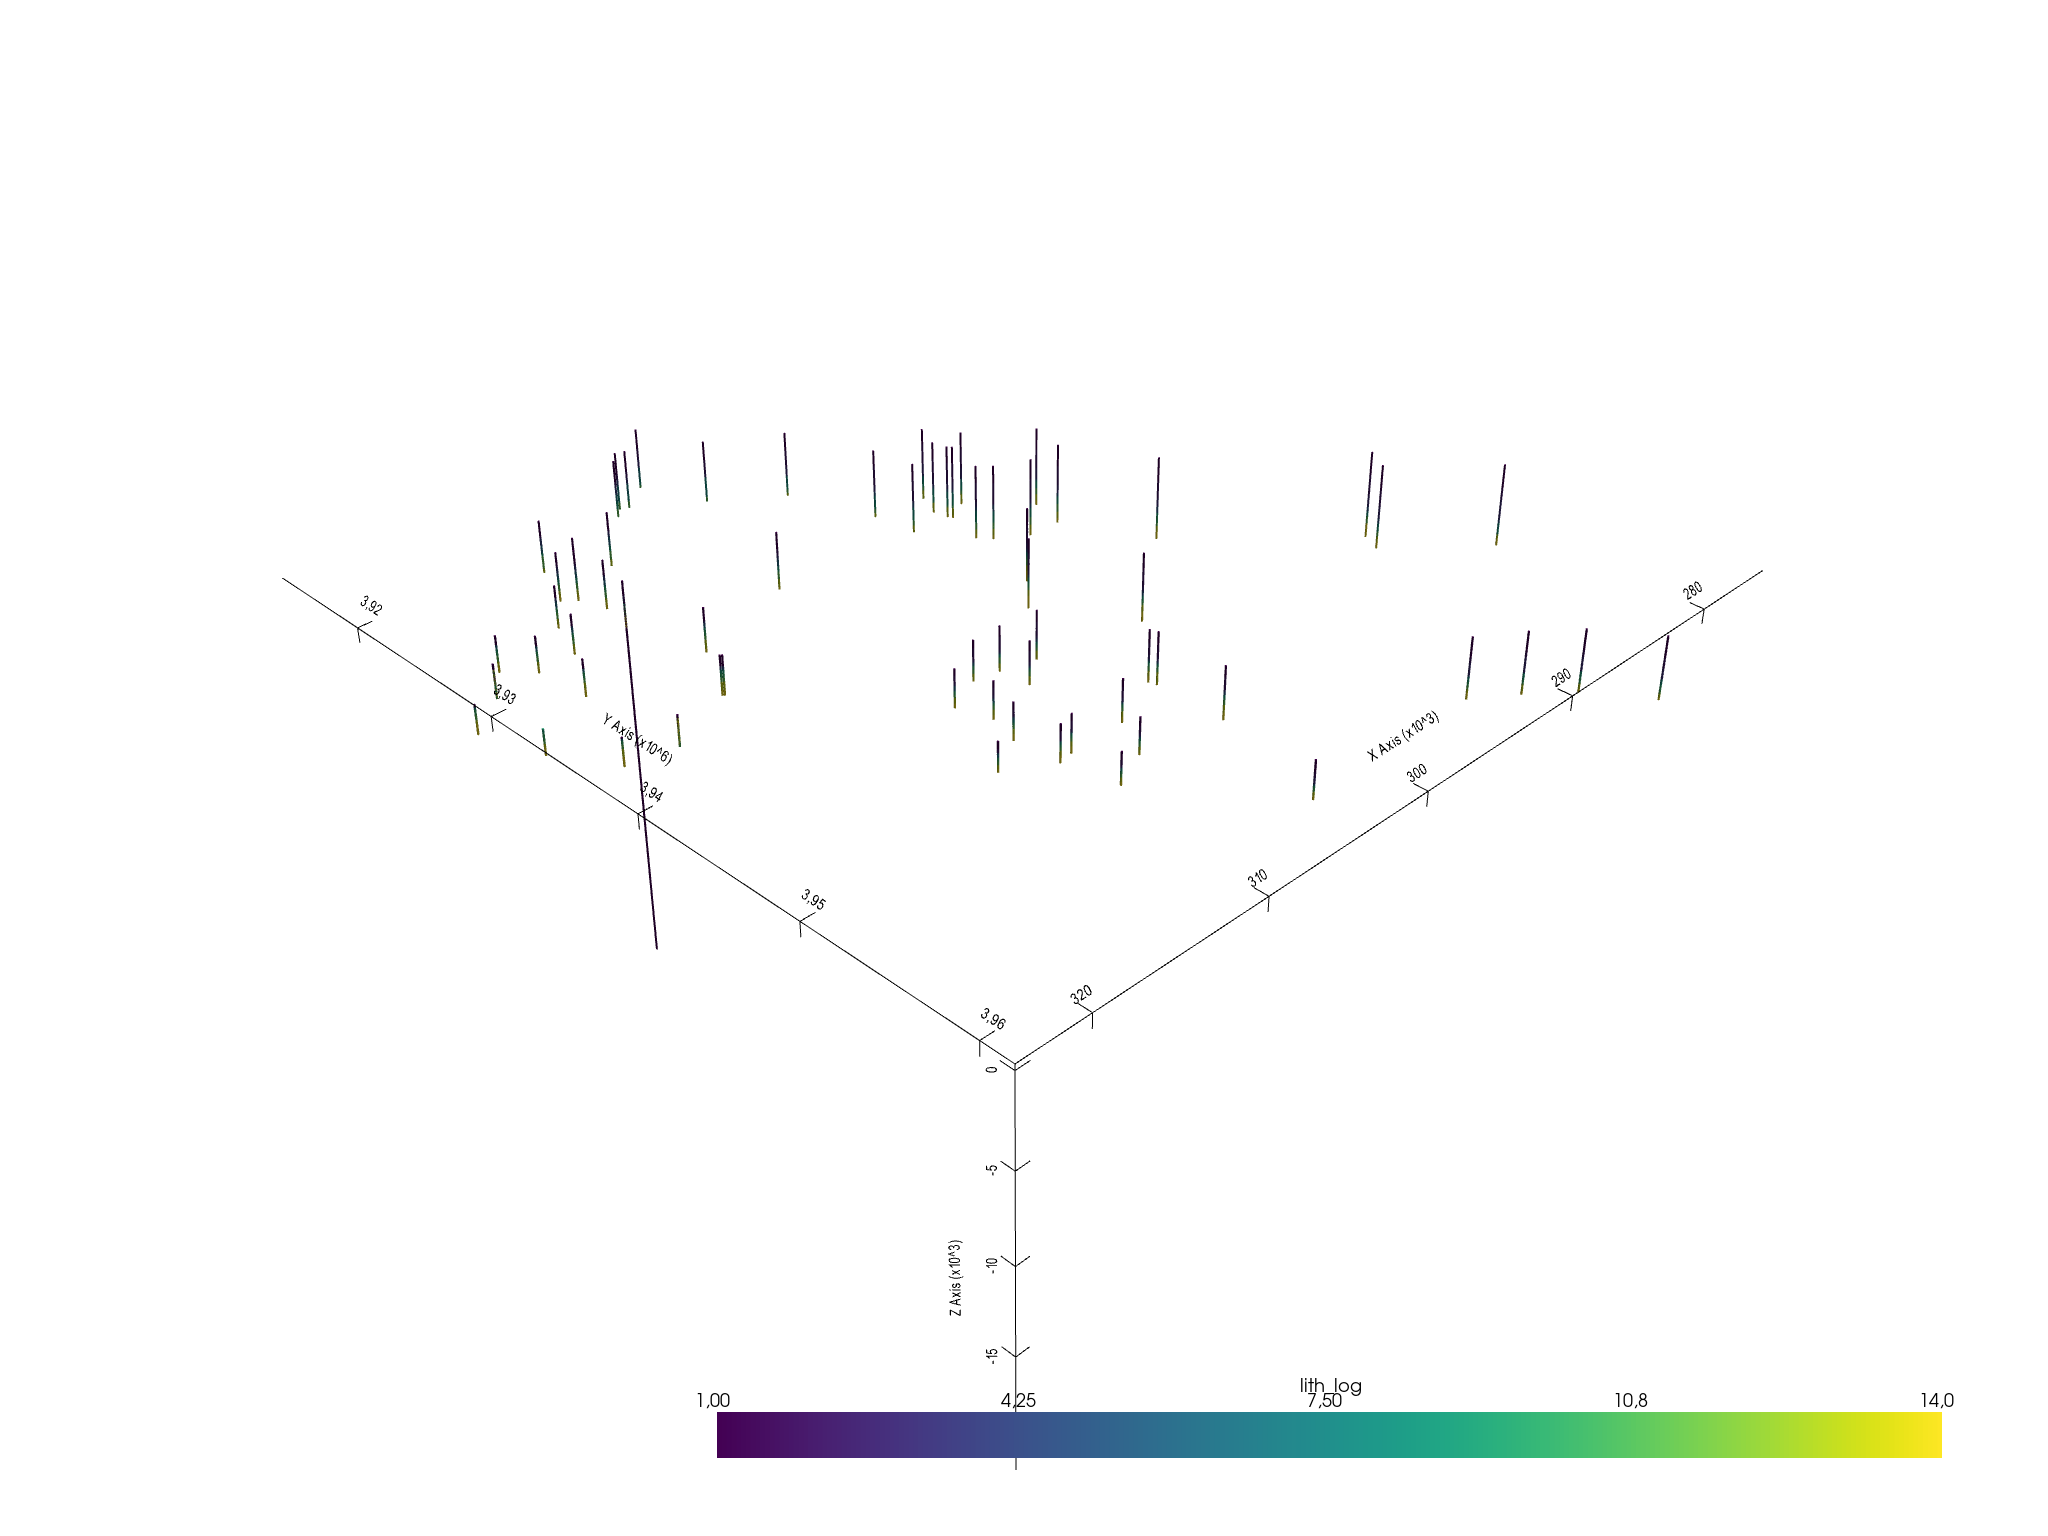
element = sb.LineSet(unstruct)
lines_mesh = sb.visualization.to_pyvista_line(element, radius=50)

# Plot default LITH
sb.visualization.pv_plot([lines_mesh])
gempy subsurface

Out:

<pyvista.plotting.plotting.Plotter object at 0x7fcb8b277250>

Findig the boreholes bases

GemPy interpolates the bottom of a unit, therefore we need to be able to extract those points to be able tointerpolate them. xarray, pandas and numpy are using the same type of memory representation what makes possible to use the same or at least similar methods to manipulate the data to our will. Lets find the base points of each well:

# Creating references to the xarray.DataArray
cells_attr = unstruct.data.cell_attrs
cells = unstruct.data.cells
vertex = unstruct.data.vertex
# Find vertex points at the boundary of two units
# Marking each vertex
bool_prop_change = cells_attr.values[1:] != cells_attr.values[:-1]
# Getting the index of the vertex
args_prop_change = np.where(bool_prop_change)[0]
# Getting the attr values at those points
vals_prop_change = cells_attr[args_prop_change]
vals_prop_change.to_pandas()
cell_attr lith_log
cell
0 1
1 2
2 3
3 5
4 8
... ...
590 8
591 9
592 10
593 11
594 13

595 rows × 1 columns


Getting the vertex values at those points

vertex_args_prop_change = cells[args_prop_change, 1]
interface_points = vertex[vertex_args_prop_change]
interface_points
<xarray.DataArray 'vertex' (cell: 595, XYZ: 3)>
array([[ 2.796350e+05,  3.942877e+06, -1.264778e+03],
       [ 2.796350e+05,  3.942877e+06, -2.227086e+03],
       [ 2.796350e+05,  3.942877e+06, -2.900701e+03],
       ...,
       [ 2.868060e+05,  3.957139e+06, -2.703431e+03],
       [ 2.868060e+05,  3.957139e+06, -2.773010e+03],
       [ 2.868060e+05,  3.957139e+06, -3.120902e+03]])
Coordinates:
    points   (cell) int64 14 24 31 34 36 39 42 ... 3332 3333 3337 3340 3341 3346
  * XYZ      (XYZ) object 'X' 'Y' 'Z'
    UWI      (cell) object Cities_Service_TennecoXX ... DearingerXX
    Depth    (cell) float64 1.299e+03 2.261e+03 ... 2.818e+03 3.166e+03
Dimensions without coordinates: cell
xarray.DataArray
'vertex'
  • cell: 595
  • XYZ: 3
  • 2.796e+05 3.943e+06 -1.265e+03 ... 2.868e+05 3.957e+06 -3.121e+03
    array([[ 2.796350e+05,  3.942877e+06, -1.264778e+03],
           [ 2.796350e+05,  3.942877e+06, -2.227086e+03],
           [ 2.796350e+05,  3.942877e+06, -2.900701e+03],
           ...,
           [ 2.868060e+05,  3.957139e+06, -2.703431e+03],
           [ 2.868060e+05,  3.957139e+06, -2.773010e+03],
           [ 2.868060e+05,  3.957139e+06, -3.120902e+03]])
    • points
      (cell)
      int64
      14 24 31 34 ... 3337 3340 3341 3346
      array([  14,   24,   31, ..., 3340, 3341, 3346])
    • XYZ
      (XYZ)
      object
      'X' 'Y' 'Z'
      array(['X', 'Y', 'Z'], dtype=object)
    • UWI
      (cell)
      object
      ...
      array([array('Cities_Service_TennecoXX', dtype=object),
             array('Cities_Service_TennecoXX', dtype=object),
             array('Cities_Service_TennecoXX', dtype=object), ...,
             array('DearingerXX', dtype=object), array('DearingerXX', dtype=object),
             array('DearingerXX', dtype=object)], dtype=object)
    • Depth
      (cell)
      float64
      ...
      array([1299.11512 , 2261.422616, 2935.037864, ..., 2748.346442, 2817.924833,
             3165.816788])


Creating a new UnstructuredData

interf_us= sb.UnstructuredData.from_array(vertex=interface_points.values, cells="points",
                                          cells_attr=vals_prop_change.to_pandas())
interf_us

Out:

<xarray.Dataset>
Dimensions:       (XYZ: 3, cell: 595, cell_attr: 1, nodes: 1, points: 595, vertex_attr: 0)
Coordinates:
  * points        (points) int64 0 1 2 3 4 5 6 7 ... 588 589 590 591 592 593 594
  * XYZ           (XYZ) <U1 'X' 'Y' 'Z'
  * cell_attr     (cell_attr) object 'lith_log'
  * vertex_attr   (vertex_attr) int64
    cell_         (cell) int64 0 1 2 3 4 5 6 7 ... 588 589 590 591 592 593 594
Dimensions without coordinates: cell, nodes
Data variables:
    vertex        (points, XYZ) float64 2.796e+05 3.943e+06 ... -3.121e+03
    cells         (cell, nodes) int64 0 1 2 3 4 5 6 ... 589 590 591 592 593 594
    cell_attrs    (cell, cell_attr) int64 1 2 3 5 8 9 11 13 ... 2 3 8 9 10 11 13
    vertex_attrs  (points, vertex_attr) float64

This new UnstructuredData object instead containing data that represent lines, contain point data at the bottom of each unit. We can plot it very similar as before:

element = sb.PointSet(interf_us)
point_mesh = sb.visualization.to_pyvista_points(element)
sb.visualization.pv_plot([lines_mesh, point_mesh])
gempy subsurface

Out:

<pyvista.plotting.plotting.Plotter object at 0x7fcc6b77a3a0>

GemPy: Initialize model

The first step to create a GemPy model is create a gempy.

import gempy as gp
geo_model = gp.create_model("getting started")
geo_model.set_regular_grid(extent=[275619, 323824, 3914125, 3961793, -3972.6, 313.922], resolution=[50,50,50])
gp.set_interpolator(geo_model, theano_optimizer='fast_compile', verbose=[])

Out:

Active grids: ['regular']
Setting kriging parameters to their default values.
Compiling theano function...
Level of Optimization:  fast_compile
Device:  cpu
Precision:  float64
Number of faults:  0
Compilation Done!
Kriging values:
                        values
range                67928.89
$C_o$            109865107.62
drift equations           [3]

<gempy.core.interpolator.InterpolatorModel object at 0x7fcb84ea4f70>

Making a model step by step.

# The temptation at this point is to bring all the points into gempy and just interpolate. However, often that strategy
# results in ill posed problems due to noise or irregularities in the data. gempy has been design to being able to
# iterate rapidly and therefore a much better workflow use to be creating the model step by step.
#
# To do that, lets define a function that we can pass the name of the formation and get the assotiated vertex. Grab from
# the interf_us the XYZ coordinates of the first layer:
def get_interface_coord_from_surfaces(surface_names: list, verbose=False):
    df = pd.DataFrame(columns=["X", "Y", "Z", "surface"])

    for e, surface_name in enumerate(surface_names):
        # The properties in subsurface start at 1
        val_property = formations.index(surface_name) + 1
        # Find the cells with the surface id
        args_from_first_surface = np.where(vals_prop_change == val_property)[0]
        if verbose: print(args_from_first_surface)
        # Find the vertex
        points_from_first_surface = interface_points[args_from_first_surface]
        if verbose: print(points_from_first_surface)

        # xarray.DataArray to pandas.DataFrame
        surface_pandas = points_from_first_surface.to_pandas()

        # Add formation column
        surface_pandas["surface"] = surface_name
        df = df.append(surface_pandas)

    return df.reset_index()

Surfaces

formations = ["topo", "etchegoin", "macoma", "chanac", "mclure",
              "santa_margarita", "fruitvale",
              "round_mountain", "olcese", "freeman_jewett", "vedder", "eocene",
              "cretaceous",
              "basement", "null"]
geo_model.add_features("Formations")
one_formation_every = 3
geo_model.add_surfaces(formations[0:4*one_formation_every:one_formation_every])

geo_model.map_stack_to_surfaces({"Formations": ["etchegoin", "macoma", "chanac", "mclure"],
                                 "Default series": ["topo"]},
                                set_series=False)
surface series order_surfaces color id
0 topo Default series 1 #015482 1
1 chanac Formations 1 #9f0052 2
2 fruitvale Formations 2 #ffbe00 3
3 freeman_jewett Formations 3 #728f02 4


gempy_surface_points = get_interface_coord_from_surfaces(formations[0:3*one_formation_every:one_formation_every])
geo_model.set_surface_points(gempy_surface_points, update_surfaces=False)
geo_model.update_to_interpolator()

Out:

True

Adding orientations

find neighbours

neighbours = gp.select_nearest_surfaces_points(geo_model, geo_model._surface_points.df, 2)

# calculate all fault orientations
gp.set_orientation_from_neighbours_all(geo_model, neighbours)
X Y Z G_x G_y G_z smooth surface
24 279635.0 3.94e+06 -1264.78 3.41e-02 2.91e-02 1.00 0.01 topo
25 292056.0 3.93e+06 -819.82 -1.50e-02 8.02e-03 1.00 0.01 topo
26 298650.0 3.95e+06 -582.32 -1.14e-01 -2.74e-02 0.99 0.01 topo
27 293291.0 3.93e+06 -829.70 -1.06e-01 -7.89e-02 0.99 0.01 topo
28 309934.0 3.95e+06 -166.96 -1.83e-02 1.66e-02 1.00 0.01 topo
29 304232.0 3.95e+06 -298.80 -2.44e-02 1.71e-02 1.00 0.01 topo
30 294111.0 3.94e+06 -810.41 -5.01e-02 3.98e-05 1.00 0.01 topo
31 316551.0 3.93e+06 -369.52 -4.08e-02 -2.75e-02 1.00 0.01 topo
32 306776.0 3.94e+06 -147.06 3.14e-02 1.24e-02 1.00 0.01 topo
33 293771.0 3.93e+06 -793.34 -1.75e-02 5.89e-03 1.00 0.01 topo
34 306155.0 3.95e+06 -213.33 1.85e-02 2.03e-02 1.00 0.01 topo
35 309582.0 3.92e+06 -850.48 -7.48e-02 -3.39e-02 1.00 0.01 topo
36 288972.0 3.96e+06 -1013.15 -1.97e-02 -1.49e-02 1.00 0.01 topo
37 286885.0 3.93e+06 -1226.40 -6.22e-02 -3.43e-03 1.00 0.01 topo
38 313018.0 3.93e+06 -580.29 -6.06e-02 -2.91e-02 1.00 0.01 topo
39 295053.0 3.93e+06 -801.37 -1.12e-01 4.12e-02 0.99 0.01 topo
40 318289.0 3.94e+06 -306.63 -1.42e-01 2.70e-01 0.95 0.01 topo
41 315508.0 3.92e+06 -483.49 -6.15e-02 -1.91e-02 1.00 0.01 topo
42 312493.0 3.92e+06 -674.47 -2.44e-01 1.73e-02 0.97 0.01 topo
43 307338.0 3.94e+06 -141.42 -3.74e-02 -8.18e-03 1.00 0.01 topo
44 305670.0 3.92e+06 -1057.70 8.76e-02 -1.07e-01 0.99 0.01 topo
45 303406.0 3.94e+06 -400.07 -9.74e-02 -1.68e-02 1.00 0.01 topo
46 295971.0 3.93e+06 -764.63 -1.52e-02 5.36e-03 1.00 0.01 topo
47 305215.0 3.92e+06 -997.36 8.76e-02 -1.07e-01 0.99 0.01 topo
48 289500.0 3.93e+06 -1078.63 -6.33e-02 2.30e-02 1.00 0.01 topo
49 302580.0 3.95e+06 -292.36 -2.38e-02 1.77e-02 1.00 0.01 topo
50 296417.0 3.92e+06 -745.21 -1.52e-02 5.36e-03 1.00 0.01 topo
51 289069.0 3.93e+06 -1061.12 -6.33e-02 2.30e-02 1.00 0.01 topo
52 293390.0 3.93e+06 -806.01 -1.75e-02 5.89e-03 1.00 0.01 topo
53 293195.0 3.92e+06 -711.04 -6.30e-03 6.27e-02 1.00 0.01 topo
54 321527.0 3.93e+06 -619.61 1.05e-01 1.19e-01 0.99 0.01 topo
55 320052.0 3.92e+06 -240.04 1.05e-01 1.19e-01 0.99 0.01 topo
56 305057.0 3.93e+06 -784.11 -3.18e-02 -2.99e-02 1.00 0.01 topo
57 318816.0 3.93e+06 -267.32 -4.21e-02 -1.89e-02 1.00 0.01 topo
58 313907.0 3.93e+06 -294.88 -2.98e-02 -3.41e-02 1.00 0.01 topo
59 291524.0 3.93e+06 -952.16 -6.29e-02 1.31e-02 1.00 0.01 topo
60 284803.0 3.96e+06 -1047.24 -1.37e-02 -8.01e-03 1.00 0.01 topo
61 313624.0 3.92e+06 -522.03 -5.62e-02 -4.87e-02 1.00 0.01 topo
62 282689.0 3.96e+06 -1052.77 -1.37e-02 -8.01e-03 1.00 0.01 topo
63 301819.0 3.92e+06 -934.13 3.19e-02 2.27e-02 1.00 0.01 topo
64 324034.0 3.93e+06 212.86 -8.89e-02 -2.74e-01 0.96 0.01 topo
65 298809.0 3.95e+06 -574.95 -6.99e-02 -9.51e-03 1.00 0.01 topo
66 297014.0 3.94e+06 -664.61 -6.20e-02 -7.26e-03 1.00 0.01 topo
67 275307.0 3.95e+06 -1239.19 3.41e-02 2.91e-02 1.00 0.01 topo
68 311901.0 3.93e+06 -481.81 -2.98e-02 -3.41e-02 1.00 0.01 topo
69 305090.0 3.94e+06 -234.80 -9.86e-02 1.14e-01 0.99 0.01 topo
70 301307.0 3.96e+06 -523.73 -3.22e-02 1.77e-02 1.00 0.01 topo
71 306230.0 3.92e+06 -1043.76 8.76e-02 -1.07e-01 0.99 0.01 topo
72 293914.0 3.93e+06 -810.55 -2.34e-02 7.56e-03 1.00 0.01 topo
73 278958.0 3.94e+06 -1205.68 3.41e-02 2.91e-02 1.00 0.01 topo
74 313989.0 3.93e+06 -294.83 -2.98e-02 -3.41e-02 1.00 0.01 topo
75 303412.0 3.91e+06 -908.82 1.03e-01 -7.10e-02 0.99 0.01 topo
76 293564.0 3.93e+06 -801.74 -1.75e-02 5.89e-03 1.00 0.01 topo
77 301267.0 3.94e+06 -457.37 -2.84e-02 -1.39e-02 1.00 0.01 topo
78 303327.0 3.94e+06 -376.83 -9.74e-02 -1.68e-02 1.00 0.01 topo
79 321052.0 3.94e+06 198.76 -1.78e-01 1.43e-02 0.98 0.01 topo
80 306708.0 3.95e+06 -259.64 -1.86e-02 5.59e-03 1.00 0.01 topo
81 298595.0 3.95e+06 -478.29 -1.14e-01 -2.74e-02 0.99 0.01 topo
82 312908.0 3.92e+06 -540.39 -5.62e-02 -4.87e-02 1.00 0.01 topo
83 312252.0 3.92e+06 -623.80 -5.62e-02 -4.87e-02 1.00 0.01 topo
84 298335.0 3.92e+06 -849.35 1.33e-02 -1.75e-02 1.00 0.01 topo
85 318532.0 3.93e+06 -171.11 1.32e-01 -1.88e-02 0.99 0.01 topo
86 307063.0 3.95e+06 -234.82 1.85e-02 2.03e-02 1.00 0.01 topo
87 307327.0 3.94e+06 -186.74 8.80e-03 1.93e-02 1.00 0.01 topo
88 312385.0 3.92e+06 -696.29 -6.18e-02 -3.33e-02 1.00 0.01 topo
89 286806.0 3.96e+06 -1033.55 -1.97e-02 -1.49e-02 1.00 0.01 topo
0 316551.0 3.93e+06 -457.85 -9.30e-02 -4.45e-02 0.99 0.01 chanac
1 309582.0 3.92e+06 -1214.21 -1.64e-02 -3.28e-02 1.00 0.01 chanac
2 313018.0 3.93e+06 -820.96 -8.76e-02 -3.72e-02 1.00 0.01 chanac
3 315508.0 3.92e+06 -671.32 -8.67e-02 -4.70e-02 1.00 0.01 chanac
4 312493.0 3.92e+06 -946.86 -6.74e-02 -4.23e-02 1.00 0.01 chanac
5 305670.0 3.92e+06 -1707.11 9.91e-03 6.43e-02 1.00 0.01 chanac
6 295971.0 3.93e+06 -2102.08 -8.05e-02 -1.78e-02 1.00 0.01 chanac
7 305215.0 3.92e+06 -1714.57 9.91e-03 6.43e-02 1.00 0.01 chanac
8 305057.0 3.93e+06 -1363.10 -7.85e-02 -5.13e-02 1.00 0.01 chanac
9 313907.0 3.93e+06 -426.25 -4.16e-02 -4.49e-02 1.00 0.01 chanac
10 313624.0 3.92e+06 -1012.95 -4.82e-02 -1.29e-01 0.99 0.01 chanac
11 324034.0 3.93e+06 180.60 -6.24e-02 -5.69e-02 1.00 0.01 chanac
12 311901.0 3.93e+06 -677.78 -4.16e-02 -4.49e-02 1.00 0.01 chanac
13 306230.0 3.92e+06 -1750.54 9.91e-03 6.43e-02 1.00 0.01 chanac
14 293914.0 3.93e+06 -2225.99 -8.05e-02 -1.78e-02 1.00 0.01 chanac
15 313989.0 3.93e+06 -425.98 -4.16e-02 -4.49e-02 1.00 0.01 chanac
16 312908.0 3.92e+06 -989.09 -4.82e-02 -1.29e-01 0.99 0.01 chanac
17 312252.0 3.92e+06 -1145.15 -4.82e-02 -1.29e-01 0.99 0.01 chanac
18 312385.0 3.92e+06 -1222.39 -8.27e-02 -3.63e-02 1.00 0.01 chanac
19 305670.0 3.92e+06 -2226.64 -1.61e-01 1.31e-03 0.99 0.01 fruitvale
20 305215.0 3.92e+06 -2301.11 -1.61e-01 1.31e-03 0.99 0.01 fruitvale
21 306230.0 3.92e+06 -2136.06 -1.61e-01 1.31e-03 0.99 0.01 fruitvale
22 303412.0 3.91e+06 -2672.53 -1.76e-01 -3.57e-02 0.98 0.01 fruitvale
23 298335.0 3.92e+06 -2387.03 -9.72e-02 -1.40e-01 0.99 0.01 fruitvale


Using the flag to subsurface, the result of the interpolation will get stored in subsurface data objects. In the future exporting to subsurface will be the default behaviour.

gp.compute_model(geo_model, to_subsurface=True)

Out:

Lithology ids
  [2. 2. 2. ... 4. 4. 4.]
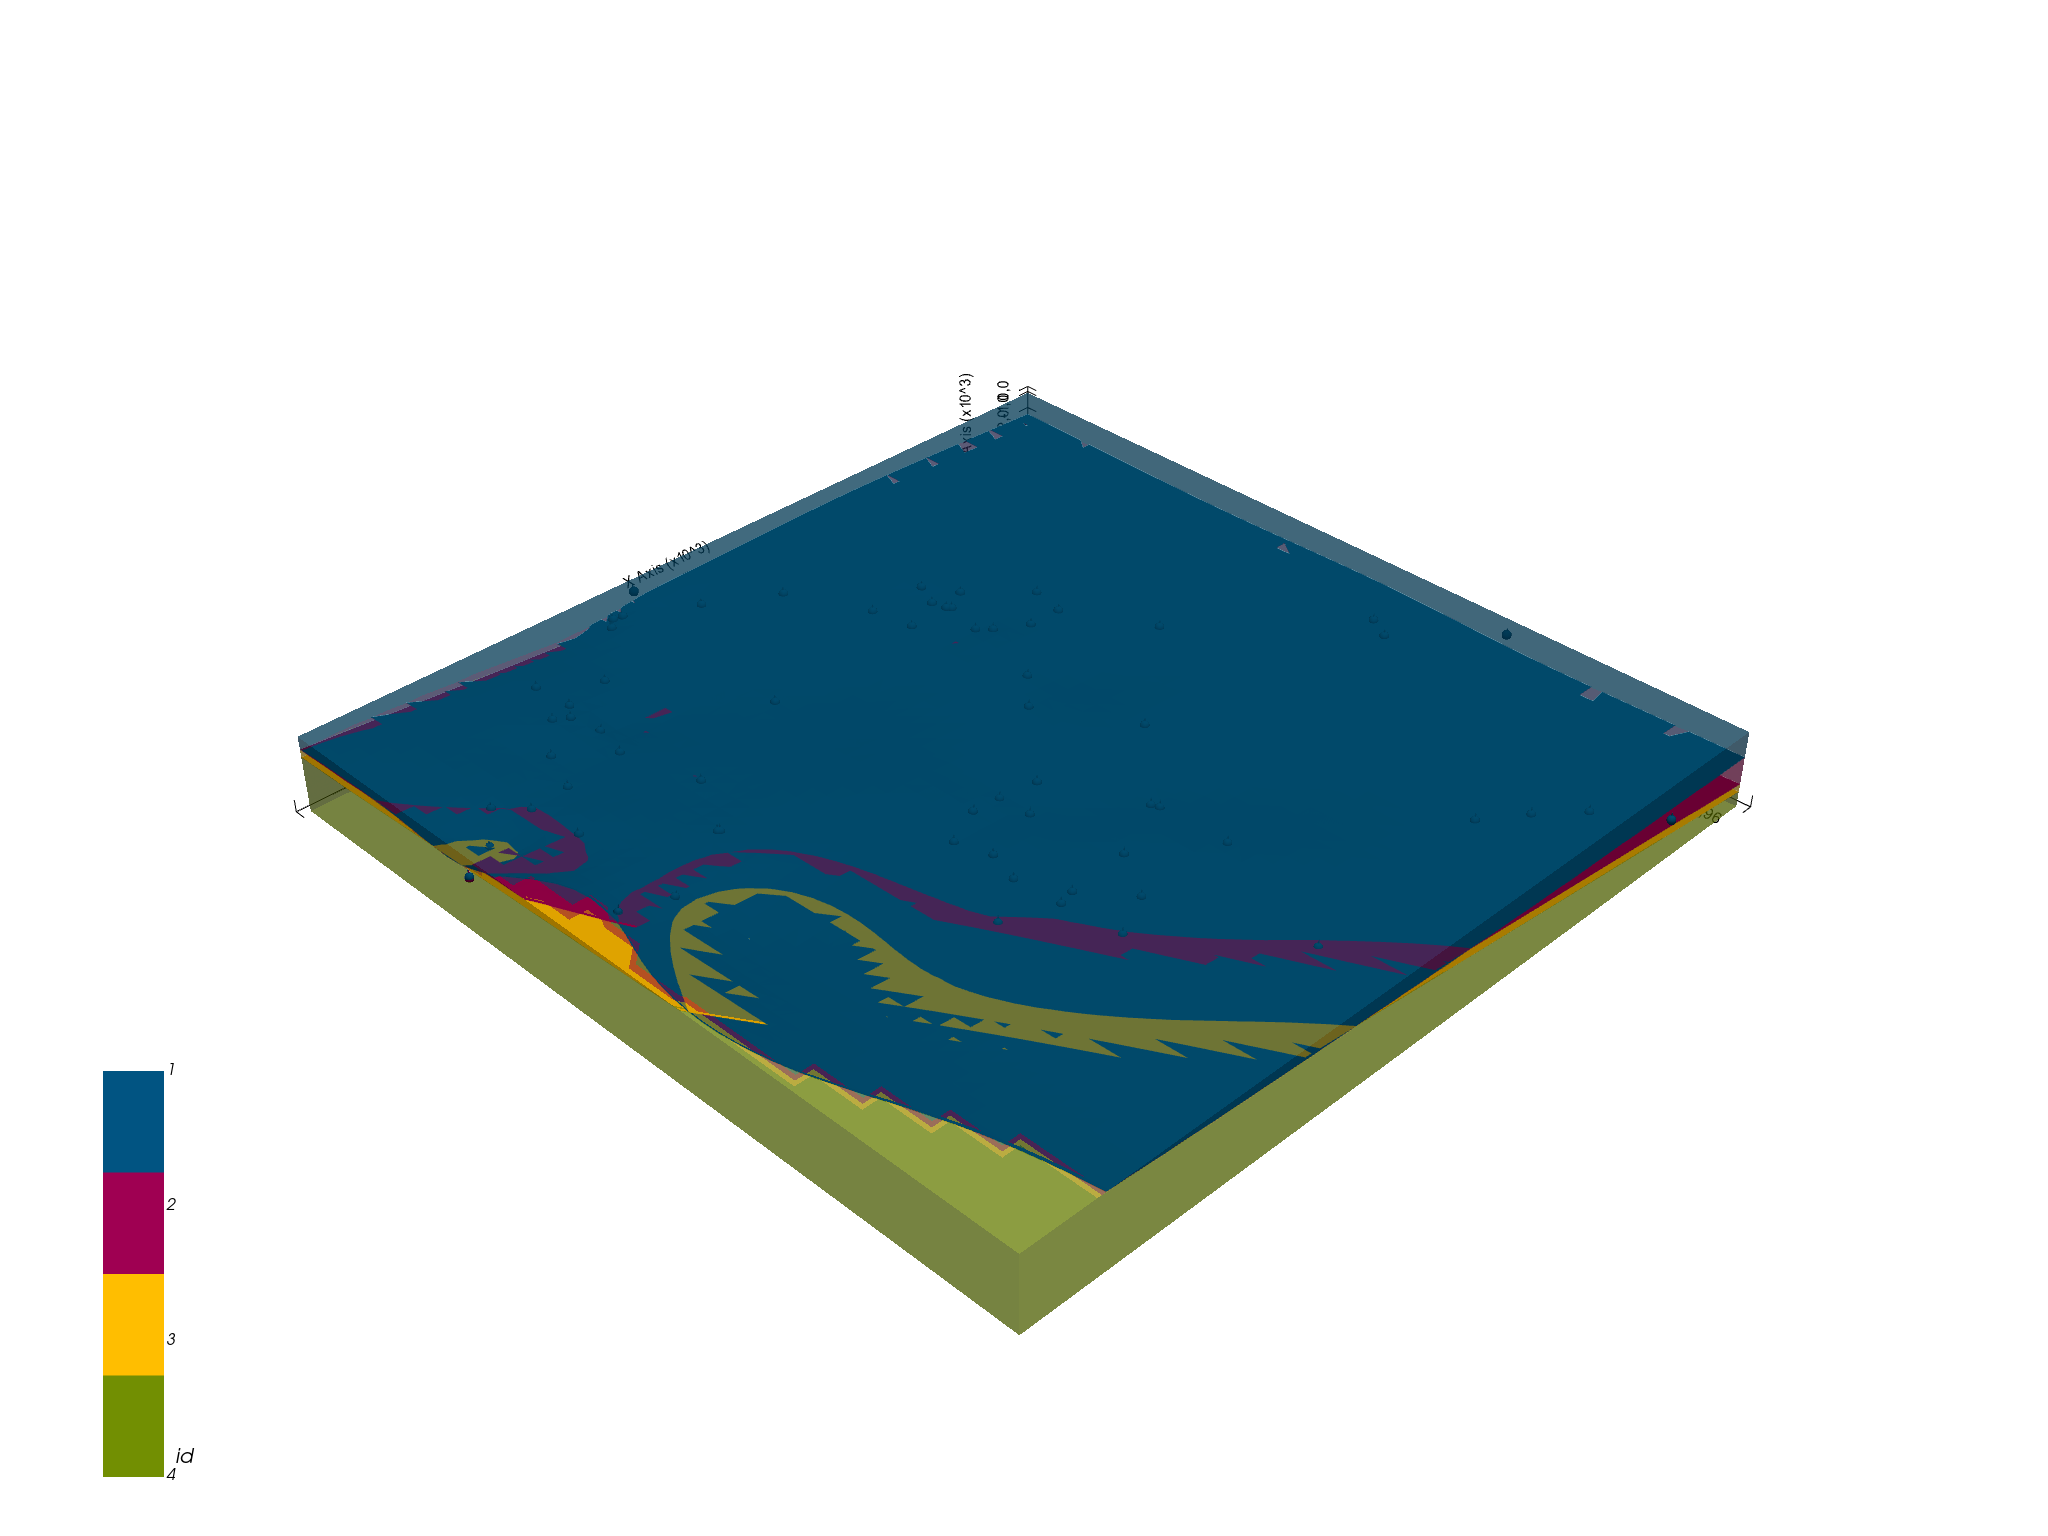
p3d = gp.plot_3d(geo_model)
gempy subsurface
geo_model.solutions.s_regular_grid

Out:

StructuredData(data=<xarray.Dataset>
Dimensions:              (Features: 2, Properties: 1, X: 50, Y: 50, Z: 50)
Coordinates:
  * Features             (Features) <U14 'Default series' 'Formations'
  * Properties           (Properties) <U2 'id'
  * X                    (X) float64 2.761e+05 2.771e+05 ... 3.224e+05 3.233e+05
  * Y                    (Y) float64 3.915e+06 3.916e+06 ... 3.96e+06 3.961e+06
  * Z                    (Z) float64 -3.93e+03 -3.844e+03 ... 185.3 271.1
Data variables:
    property_matrix      (Properties, X, Y, Z) float64 2.0 2.0 2.0 ... 4.0 4.0
    block_matrix         (Features, Properties, X, Y, Z) float64 2.0 2.0 ... 4.0
    scalar_field_matrix  (Features, X, Y, Z) float64 0.8969 0.8986 ... 0.8362
    mask_matrix          (Features, X, Y, Z) bool False False ... True True
    fault_mask           (Features, X, Y, Z) bool False False ... False False, data_array_name='data_array')
geo_model.solutions.meshes

Out:

<xarray.Dataset>
Dimensions:       (XYZ: 3, cell: 27514, cell_attr: 1, nodes: 3, points: 14290, vertex_attr: 0)
Coordinates:
  * points        (points) int64 0 1 2 3 4 5 ... 14285 14286 14287 14288 14289
  * XYZ           (XYZ) <U1 'X' 'Y' 'Z'
  * cell_attr     (cell_attr) object 'id'
  * vertex_attr   (vertex_attr) int64
    cell_         (cell) int64 0 1 2 3 4 5 ... 27509 27510 27511 27512 27513
Dimensions without coordinates: cell, nodes
Data variables:
    vertex        (points, XYZ) float64 2.769e+05 3.915e+06 ... 3.943e+06 271.1
    cells         (cell, nodes) int32 2 1 0 1 3 ... 14212 14289 14219 14215
    cell_attrs    (cell, cell_attr) float64 1.0 1.0 1.0 1.0 ... 3.0 3.0 3.0 3.0
    vertex_attrs  (points, vertex_attr) float64

Total running time of the script: ( 0 minutes 15.762 seconds)

Download Python source code: gempy_subsurface.py

Download Jupyter notebook: gempy_subsurface.ipynb

Gallery generated by Sphinx-Gallery

Logo

https://secure.travis-ci.org/cgre-aachen/gempy.svg?branch=master

Navigation

  • About
  • Installation
  • Additional projects

Getting started

  • Getting Started
  • GemPy Tutorials
  • Examples
  • Integrations
    • Export a geological model from GemPy to use in MOOSE
    • Transform 2019: Integrating Striplog and GemPy
    • GemPy - Subsurface Link

API Reference

  • Code

Related Topics

  • Documentation overview
    • Integrations
      • Previous: Transform 2019: Integrating Striplog and GemPy
      • Next: Code

Quick search

©2017-2021, CGRE-Aachen Team. | Powered by Sphinx 3.4.3 & Alabaster 0.7.12 | Page source