Note
Go to the end to download the full example code
Alesmodel: Plotting sections and maps.
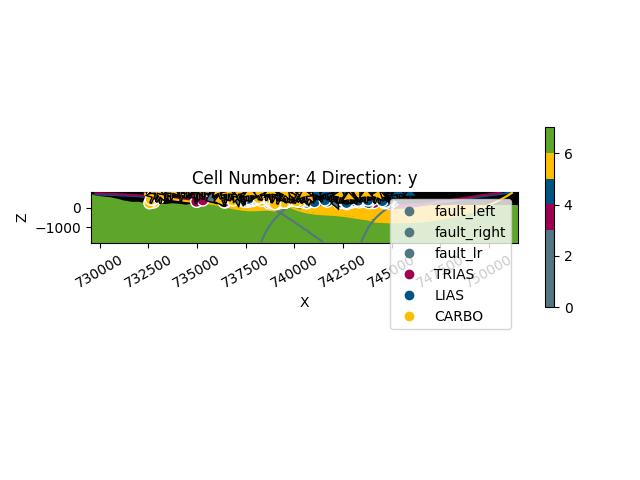
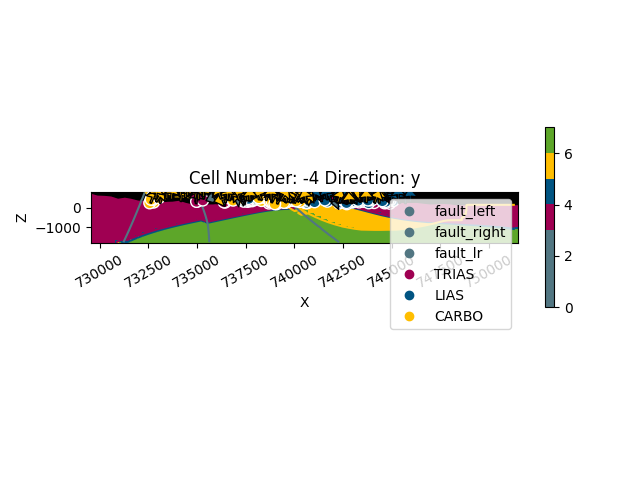
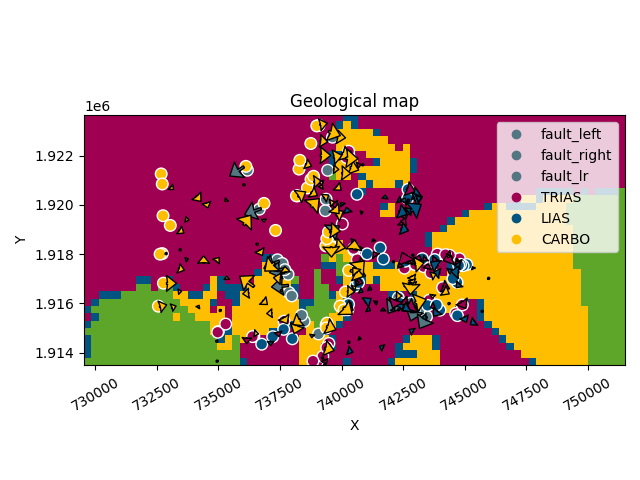
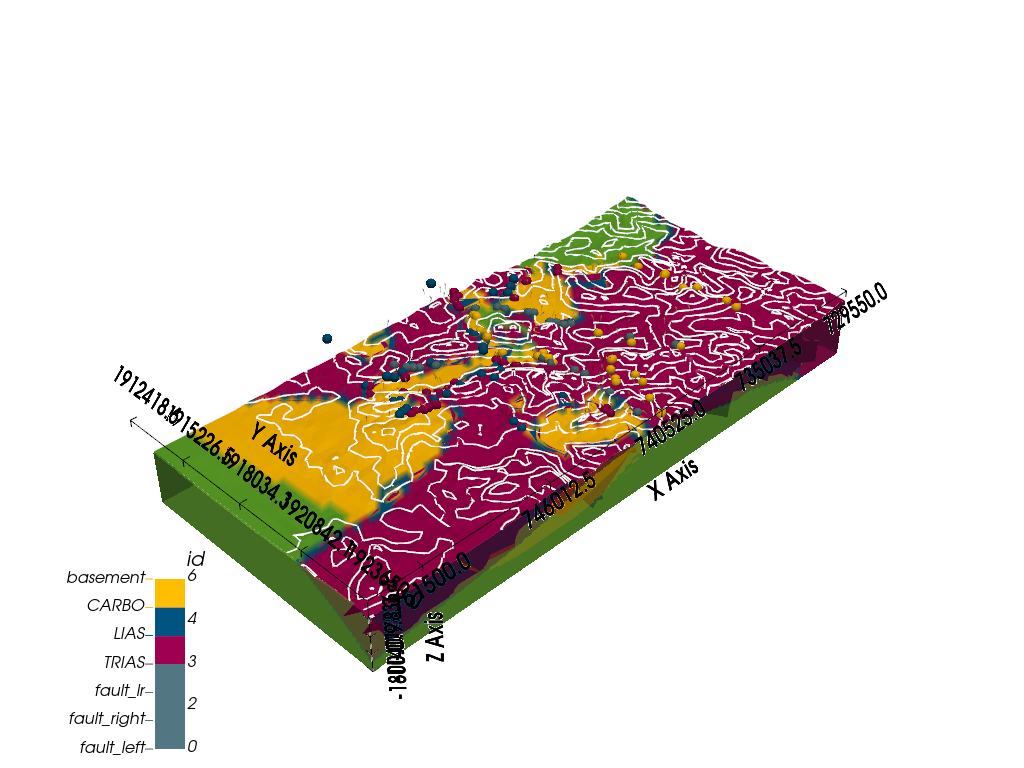
# %% # .. admonition:: Explanation # # This model is quite unstable in general and requires float64 to find a solution. The lack of data on # one of the corners for the TRIAS and LIAS series makes that the model bends in an unrealistic # way and erodes CARBO that disappears on that section. The easy way to solve this is to add more data in that area but # I leave as it is since I did no constructed the model. #
import gempy as gp
import gempy_viewer as gpv
import os
import numpy as np
cwd = os.getcwd()
if 'examples' not in cwd:
    data_path = os.getcwd() + '/examples'
else:
    data_path = cwd + '/../..'

path_interf = data_path + "/data/input_data/AlesModel/2018_interf.csv"
path_orient = data_path + "/data/input_data/AlesModel/2018_orient_clust_n_init5_0.csv"
path_dem = data_path + "/data/input_data/AlesModel/_cropped_DEM_coarse.tif"
geo_model: gp.data.GeoModel = gp.create_geomodel(
    project_name='Claudius',
    extent=[729550.0, 751500.0, 1913500.0, 1923650.0, -1800.0, 800.0],
    resolution=[100, 100, 100],
    refinement=6,
    importer_helper=gp.data.ImporterHelper(
        path_to_orientations=path_orient,
        path_to_surface_points=path_interf,
    )
)
gp.set_section_grid(
    grid=geo_model.grid,
    section_dict={
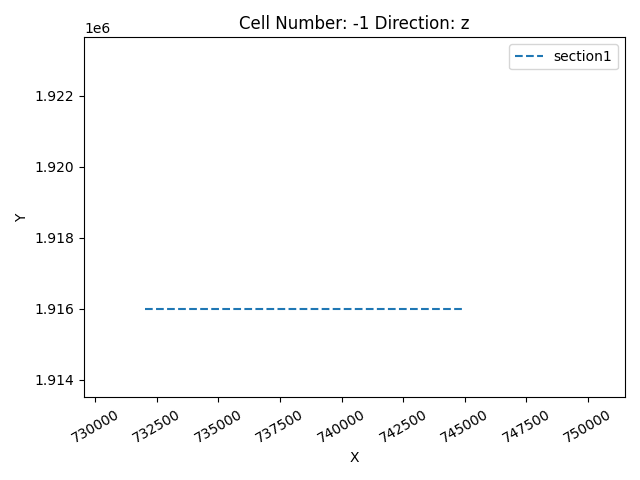
        'section1': ([732000, 1916000], [745000, 1916000], [200, 150])
    }
)
Active grids: ['sections']
sorting of lithologies
gp.map_stack_to_surfaces(
    gempy_model=geo_model,
    mapping_object={
        'fault_left'     : 'fault_left',
        'fault_right'    : 'fault_right',
        'fault_lr'       : 'fault_lr',
        'Trias_Series'   : ('TRIAS', 'LIAS'),
        'Carbon_Series'  : 'CARBO',
        'Basement_Series': 'basement'
    },
    remove_unused_series=True
)
Could not find element 'basement' in any group.
Change colors
geo_model.structural_frame.get_element_by_name("LIAS").color = "#015482"
geo_model.structural_frame.get_element_by_name("TRIAS").color = "#9f0052"
geo_model.structural_frame.get_element_by_name("CARBO").color = "#ffbe00"
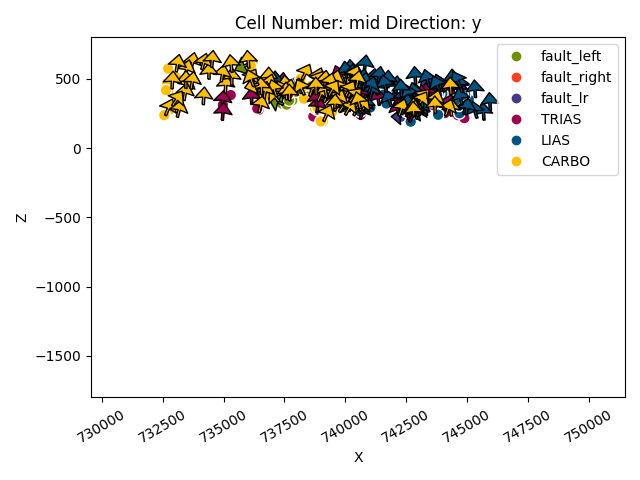
a = gpv.plot_2d(geo_model, direction='y')
gpv.plot_section_traces(geo_model)
<function plot_section_traces at 0x7fe0d9167010>
Faults
gp.set_is_fault(
    frame=geo_model.structural_frame,
    fault_groups=[
        geo_model.structural_frame.get_group_by_name('fault_left'),
        geo_model.structural_frame.get_group_by_name('fault_right'),
        geo_model.structural_frame.get_group_by_name('fault_lr')
    ],
    change_color=True
)
Topography
gp.set_topography_from_file(
    grid=geo_model.grid,
    filepath=path_dem,
    crop_to_extent=[729550.0, 751500.0, 1_913_500.0, 1923650.0]
)


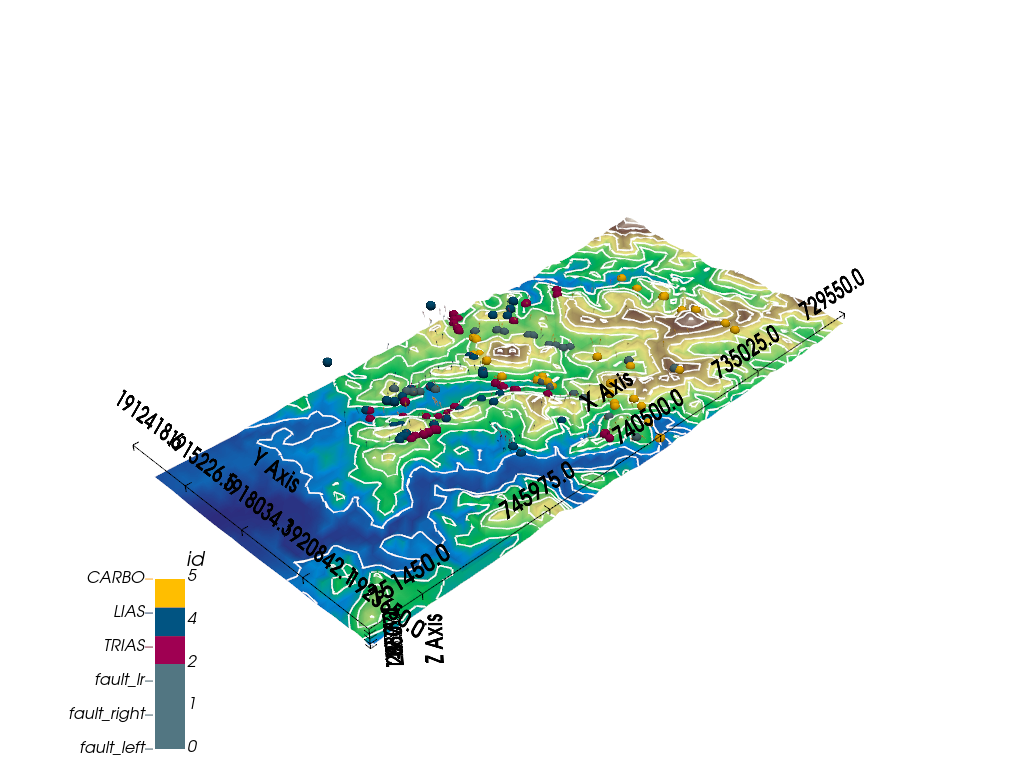
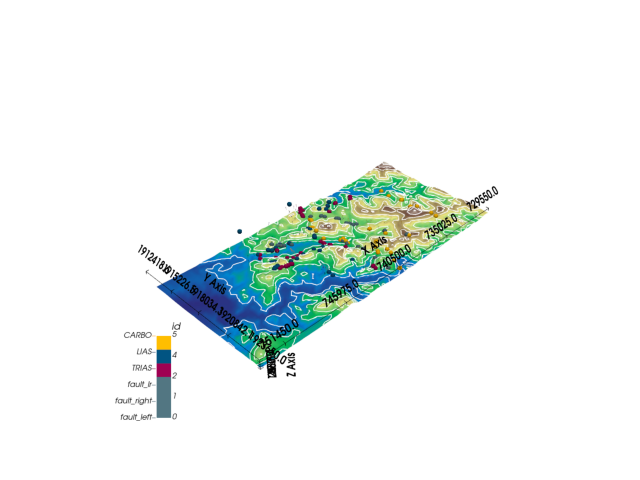
gpv.plot_3d(geo_model, show_topography=True, ve=1, image=True)
/home/leguark/subsurface/subsurface/reader/__init__.py:14: UserWarning: Welly or Striplog not installed. No well reader possible.
  warnings.warn("Welly or Striplog not installed. No well reader possible.")
Active grids: ['topography' 'sections']

<gempy_viewer.modules.plot_3d.vista.GemPyToVista object at 0x7fe0c89c2a40>
carbo = geo_model.structural_frame.get_group_by_name("Carbon_Series")
StructuralFrame(
        structural_groups=[
StructuralGroup(
        name=fault_left,
        structural_relation=StackRelationType.FAULT,
        elements=[
Element(
        name=fault_left,
        color=#527682,
        is_active=True
)
]
),
StructuralGroup(
        name=fault_right,
        structural_relation=StackRelationType.FAULT,
        elements=[
Element(
        name=fault_right,
        color=#527682,
        is_active=True
)
]
),
StructuralGroup(
        name=fault_lr,
        structural_relation=StackRelationType.FAULT,
        elements=[
Element(
        name=fault_lr,
        color=#527682,
        is_active=True
)
]
),
StructuralGroup(
        name=Trias_Series,
        structural_relation=StackRelationType.ERODE,
        elements=[
Element(
        name=TRIAS,
        color=#9f0052,
        is_active=True
),
Element(
        name=LIAS,
        color=#015482,
        is_active=True
)
]
),
StructuralGroup(
        name=Carbon_Series,
        structural_relation=StackRelationType.ERODE,
        elements=[
Element(
        name=CARBO,
        color=#ffbe00,
        is_active=True
)
]
)
],
        fault_relations=
[[False, False, False,  True,  True],
 [False, False, False,  True,  True],
 [False, False, False,  True,  True],
 [False, False, False, False, False],
 [False, False, False, False, False]],
_ = gp.compute_model(
    geo_model,
    engine_config=gp.data.GemPyEngineConfig(
        use_gpu=True,
        dtype="float64"
    ))


gpv.plot_2d(geo_model, show_topography=False, section_names=['topography'], show_lith=True)
Setting Backend To: AvailableBackends.numpy
/home/leguark/gempy/gempy/core/data/geo_model.py:164: UserWarning: You are using refinement and passing a regular grid. The resolution of the regular grid will be overwritten
  warnings.warn(
/home/leguark/gempy_viewer/gempy_viewer/API/_plot_2d_sections_api.py:106: UserWarning: Section contacts not implemented yet. We need to pass scalar field for the sections grid
  warnings.warn(

<gempy_viewer.modules.plot_2d.visualization_2d.Plot2D object at 0x7fe0c8643b50>
<gempy_viewer.modules.plot_2d.visualization_2d.Plot2D object at 0x7fe0845c8e80>
sphinx_gallery_thumbnail_number = -1
gpv.plot_3d(geo_model, show_lith=True, show_topography=True, kwargs_plot_structured_grid={'opacity': 0.8})
<gempy_viewer.modules.plot_3d.vista.GemPyToVista object at 0x7fe0d9c2a5c0>
Total running time of the script: (1 minutes 40.412 seconds)
