Note
Go to the end to download the full example code
Hecho
import os

import numpy as np
# Aux imports
import pandas as pn

# Importing gempy
import gempy as gp
import gempy_viewer as gpv
Loading surface points from repository:
With pandas we can do it directly from the web and with the right args we can directly tidy the data in gempy style:
data_path = os.path.abspath('../../data/input_data/Hecho')
dfs = []

# First stratigraphic data
for letter in range(1, 10):
    dfs.append(pn.read_csv(
        filepath_or_buffer=data_path + '/H' + str(letter) + '.csv',
        sep=';',
        names=['X', 'Y', 'Z', 'surface', '_'],
        header=0
    ))

# Also faults
for f in range(1, 4):
    fault_df = pn.read_csv(
        filepath_or_buffer=data_path + '/F' + str(f) + 'Line.csv',
        sep=';',
        names=['X', 'Y', 'Z'],
        header=0
    )
    fault_df['surface'] = 'f' + str(f)
    dfs.append(fault_df)

# We put all the surfaces points together because is how gempy likes it:
surface_points = pn.concat(dfs, sort=True)
surface_points.reset_index(inplace=True, drop=False)
surface_points.tail()
Now we do the same with the orientations:
orientations = pn.read_csv(
    filepath_or_buffer=data_path + '/Dips.csv',
    sep=';',
    names=['X', 'Y', 'Z', 'G_x', 'G_z', '_'],
    header=0
)
# Orientation needs to belong to a surface. This is mainly to categorize to which series belong and to
# use the same color
orientations['surface'] = 0

# We fill the laking direction with a dummy value:
orientations['G_y'] = 0

# Replace -99999.00000 with NaN
orientations.replace(-99999.00000, np.nan, inplace=True)

# Drop irrelevant columns
orientations.drop(columns=['_'], inplace=True)

# Remove rows containing NaN
orientations.dropna(inplace=True)
Data initialization:
Suggested size of the axis-aligned modeling box: Origin: 0 -0.5 0 Maximum: 16 0.5 4.5
Suggested resolution: 0.05m (grid size 321 x 21 x 91)
%%
surface_points_table: gp.data.SurfacePointsTable = gp.data.SurfacePointsTable.from_arrays(
    x=surface_points['X'].values,
    y=surface_points['Y'].values,
    z=surface_points['Z'].values,
    names=surface_points['surface'].values.astype(str)
)

orientations_table: gp.data.OrientationsTable = gp.data.OrientationsTable.from_arrays(
    x=orientations['X'].values,
    y=orientations['Y'].values,
    z=orientations['Z'].values,
    G_x=orientations['G_x'].values,
    G_y=orientations['G_y'].values,
    G_z=orientations['G_z'].values,
    names=orientations['surface'].values.astype(str),
    name_id_map=surface_points_table.name_id_map  # ! Make sure that ids and names are shared
)

structural_frame: gp.data.StructuralFrame = gp.data.StructuralFrame.from_data_tables(
    surface_points=surface_points_table,
    orientations=orientations_table
)

geo_model: gp.data.GeoModel = gp.create_geomodel(
    project_name='Moureze',
    extent=[0, 16, -0.5, 0.5, 0, 4.5],
    resolution=[321, 21, 91],
    refinement=4,
    structural_frame=structural_frame
)

gp.set_section_grid(
    grid=geo_model.grid,
    section_dict={
        'section': ([0, 0], [16, 0], [321, 91])
    },
)
Active grids: ['sections']
We need an orientation per series/fault. The faults does not have orientation so the easiest is to create an orientation from the surface points availablle:
f_names = ['f1', 'f2', 'f3']
for fn in f_names:
    element = geo_model.structural_frame.get_element_by_name(fn)
    new_orientations = gp.create_orientations_from_surface_points_coords(
        xyz_coords=element.surface_points.xyz
    )
    gp.add_orientations(
        geo_model=geo_model,
        x=new_orientations.data['X'],
        y=new_orientations.data['Y'],
        z=new_orientations.data['Z'],
        pole_vector=new_orientations.grads,
        elements_names=fn
    )
Now we can see how the data looks so far:
gpv.plot_2d(geo_model)
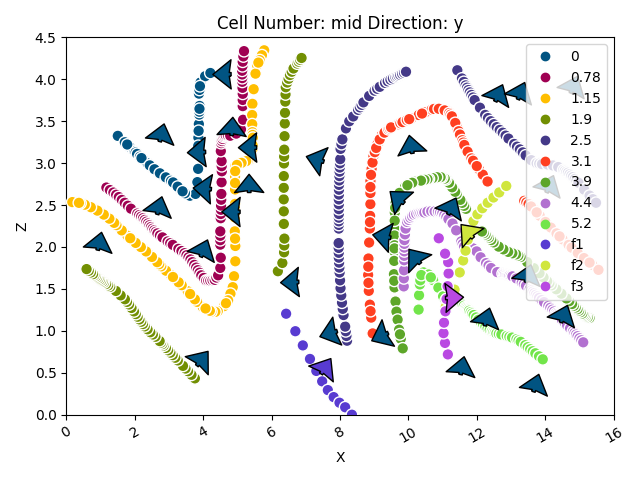
<gempy_viewer.modules.plot_2d.visualization_2d.Plot2D object at 0x7f08ac8b9e40>
By default all surfaces belong to one unique series.
We will need to separate with surface belong to each series:
gp.map_stack_to_surfaces(
    gempy_model=geo_model,
    mapping_object={'Fault1': 'f1', 'Fault2': 'f2', 'Fault3': 'f3'}
)
However if we want the faults to offset the “Default series”, they will need to be more recent (higher on the pile). We can modify the order by:
Lastly, so far we did not specify which series/faults are actula faults:
gp.set_is_fault(
    frame=geo_model,
    fault_groups=['Fault1', 'Fault2', 'Fault3']
)
The default range is always the diagonal of the extent. Since in this model data is very close we will need to reduce the range to 5-10% of that value:
geo_model.interpolation_options.kernel_options.range *= 0.2
gp.compute_model(geo_model, gp.data.GemPyEngineConfig(use_gpu=True, dtype='float64'))
Setting Backend To: AvailableBackends.numpy
/home/leguark/gempy/gempy/core/data/geo_model.py:164: UserWarning: You are using refinement and passing a regular grid. The resolution of the regular grid will be overwritten
  warnings.warn(
Time
GTX 2080 164 ms ± 2.03 ms per loop (mean ± std. dev. of 7 runs, 1 loop each)
gpv.plot_2d(geo_model, cell_number=[10], series_n=3, show_scalar=True)
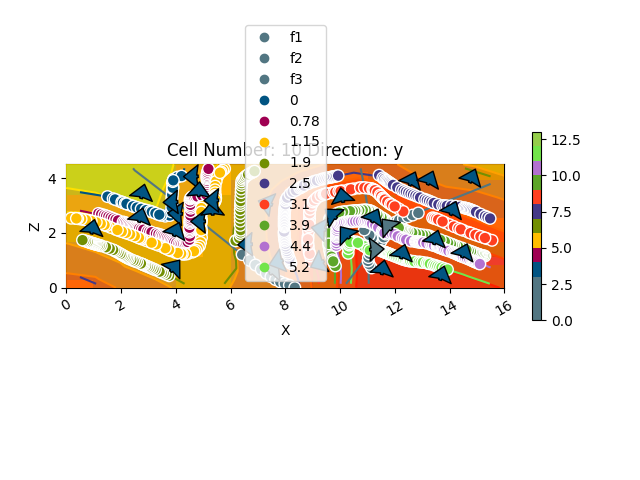
<gempy_viewer.modules.plot_2d.visualization_2d.Plot2D object at 0x7f08ac4d0790>
gpv.plot_2d(geo_model, cell_number=[10], show_data=True)
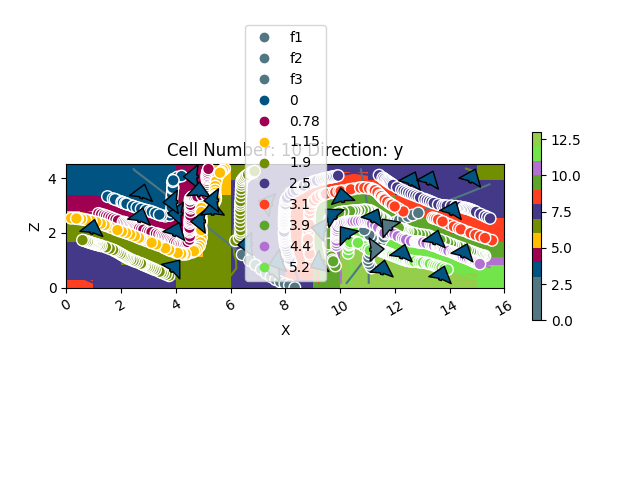
<gempy_viewer.modules.plot_2d.visualization_2d.Plot2D object at 0x7f08ac4c55d0>
gpv.plot_2d(geo_model, section_names=['section'], show_data=True)
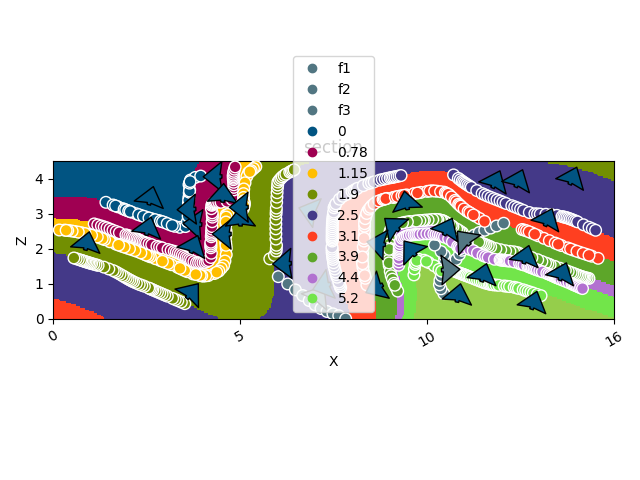
/home/leguark/gempy_viewer/gempy_viewer/API/_plot_2d_sections_api.py:106: UserWarning: Section contacts not implemented yet. We need to pass scalar field for the sections grid
  warnings.warn(

<gempy_viewer.modules.plot_2d.visualization_2d.Plot2D object at 0x7f08ac8ba500>
sphinx_gallery_thumbnail_number = 3
gpv.plot_3d(geo_model, kwargs_plot_structured_grid={'opacity': .2})
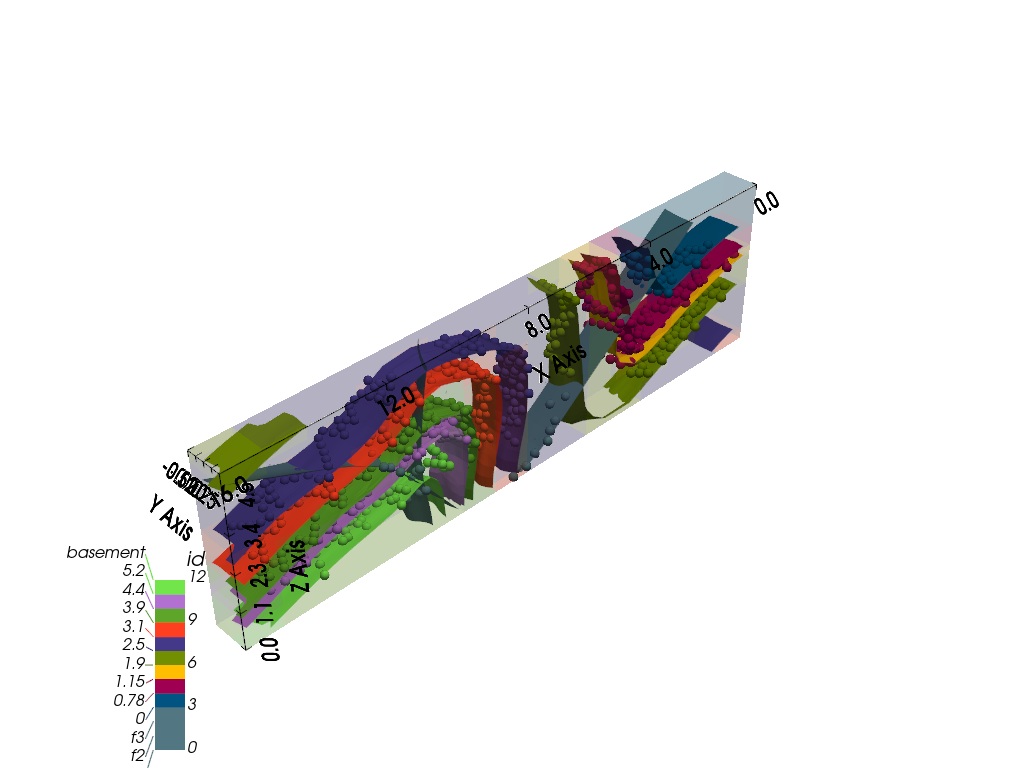
<gempy_viewer.modules.plot_3d.vista.GemPyToVista object at 0x7f08f546fa00>
Total running time of the script: (0 minutes 59.419 seconds)
