Note
Go to the end to download the full example code
Getting Started
# Importing GemPy and viewer
import gempy as gp
import gempy_viewer as gpv

# Auxiliary libraries
import numpy as np
import matplotlib.pyplot as plt
import matplotlib.image as mpimg
Initializing the model:
Create a gempy.Model object. This object will contain all other data structures and necessary functionality. We’ll also define a regular grid for this example. This grid will be used for interpolating the 3D geological model. GemPy offers different grids for various purposes. For visualization, a regular grid is most appropriate.
geo_model: gp.data.GeoModel = gp.create_geomodel(
    project_name='Model1',
    extent=[0, 791, -200, 200, -582, 0],
    resolution=[50, 50, 50],
    refinement=4,
    structural_frame=gp.data.StructuralFrame.initialize_default_structure()
)
geo_model
{'grid': <gempy.core.data.grid.Grid object at 0x7f08f5690520>,
 'interpolation_options': InterpolationOptions(kernel_options={'range': 5, 'c_o': 10, 'uni_degree': 1, 'i_res': 4, 'gi_res': 2, 'number_dimensions': 3, 'kernel_function': <AvailableKernelFunctions.cubic: KernelFunction(base_function=<function cubic_function at 0x7f090b7b1cf0>, derivative_div_r=<function cubic_function_p_div_r at 0x7f090b7b1d80>, second_derivative=<function cubic_function_a at 0x7f090b7b1e10>, consume_sq_distance=False)>, 'compute_condition_number': False, 'kernel_solver': <Solvers.DEFAULT: 1>}, number_octree_levels=4, current_octree_level=0, compute_scalar_gradient=False, mesh_extraction=True, mesh_extraction_masking_options=MeshExtractionMaskingOptions.INTERSECT, mesh_extraction_fancy=True, debug=True, debug_water_tight=False, sigmoid_slope=50000, _number_octree_levels_surface=4),
 'meta': GeoModelMeta(name='Model1',
                      creation_date=None,
                      last_modification_date=None,
                      owner=None),
 'structural_frame': StructuralFrame(
    structural_groups=[
StructuralGroup(
    name=default_formations,
    structural_relation=StackRelationType.ERODE,
    elements=[
Element(
    name=surface1,
    color=#015482,
    is_active=True
)
]
)
],
    fault_relations=
[[False]],
,
 'transform': {'_is_default_transform': True,
 'position': array([0., 0., 0.]),
 'rotation': array([0., 0., 0.]),
 'scale': array([1., 1., 1.])}}
Creating a figure:
GemPy utilizes matplotlib for 2D and pyvista-vtk for 3D visualizations. One design goal of GemPy is real-time model construction. This means as input data is added, you can see the 3D surfaces update in real-time. Let’s initialize the visualization windows. First, the 2D figure:
p2d = gpv.plot_2d(geo_model)
Adding a model section:
In the 2D renderer, we can add several cross sections of the model. For simplicity, we’ll add just one, perpendicular to y.
Loading a cross-section image:
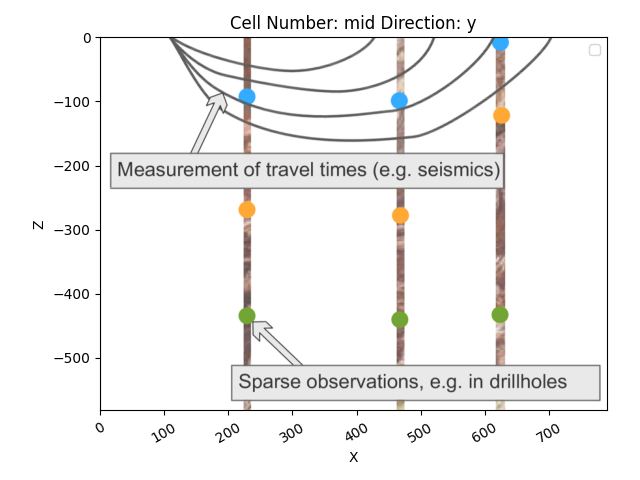
GemPy uses standard matplotlib axes, allowing for flexibility. Let’s load an image showing the details of a couple of boreholes:
Similarly, we can visualize in 3D using pyvista and vtk:
p3d = gpv.plot_3d(geo_model, image=True)
Building the model:
With everything initialized, we can begin constructing the geological model.
Surfaces:
GemPy is a surface-based interpolator. All input data must be referred to a surface, which marks the bottom of a unit. By default, GemPy surfaces are empty:
[Element(
    name=surface1,
    color=#015482,
    is_active=True
), Element(
    name=basement,
    color=#9f0052,
    is_active=True
)]
Let’s begin by adding data. GemPy input data consists of surface points and orientations (perpendicular to the layers). The 2D plot provides X and Z coordinates on mouse hover (in qt5 backend). We can add a surface point like this:
<gempy_viewer.modules.plot_3d.vista.GemPyToVista object at 0x7f08f21222c0>
We can now add other points for the layer:
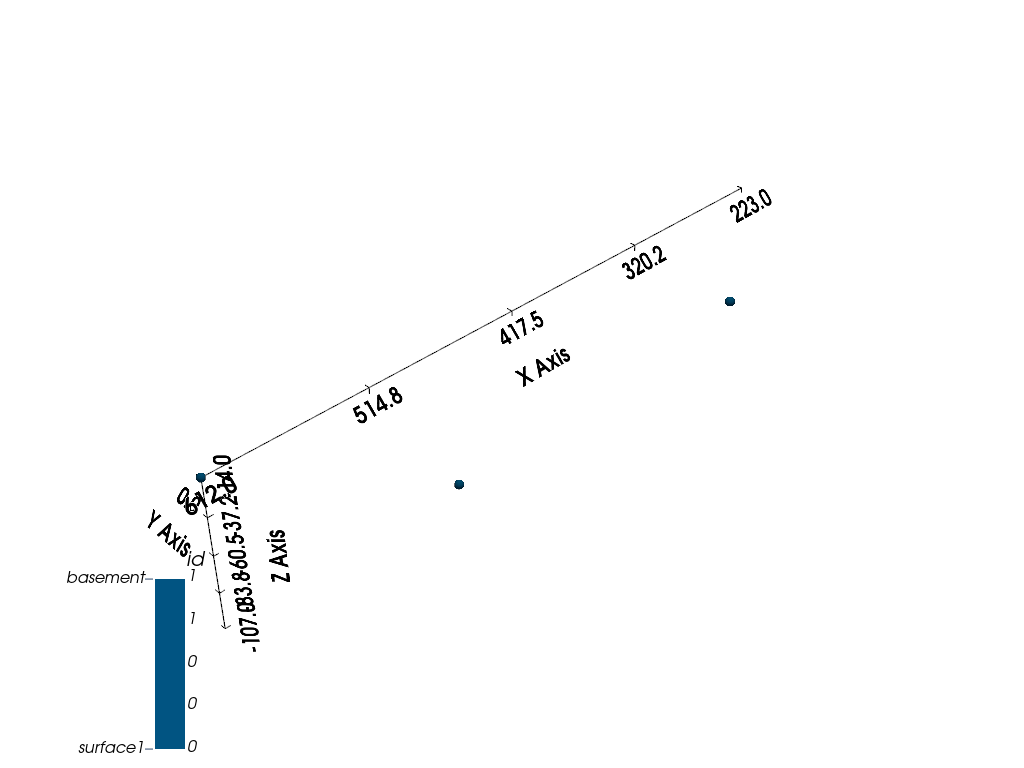
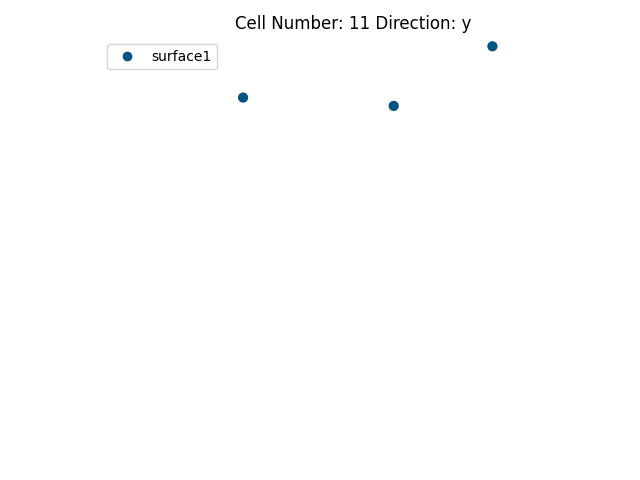
<gempy_viewer.modules.plot_3d.vista.GemPyToVista object at 0x7f088aa13010>
To interpolate in gempy, the minimum data needed is:
2 surface points per surface
One orientation per series
Let’s add an orientation:
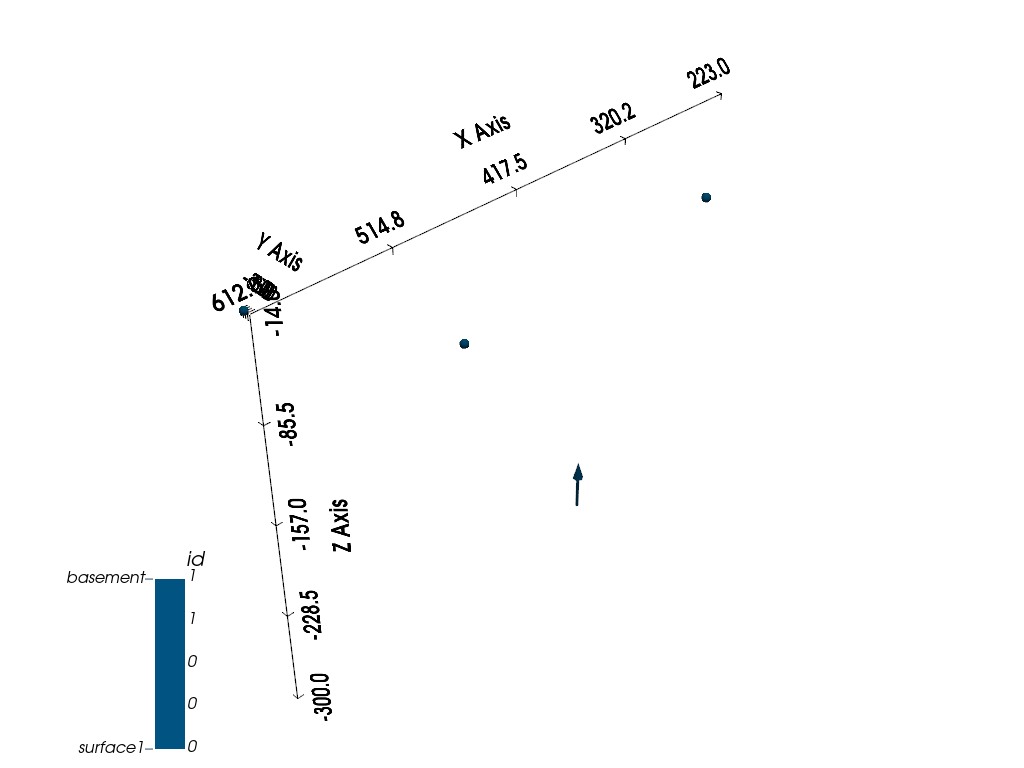
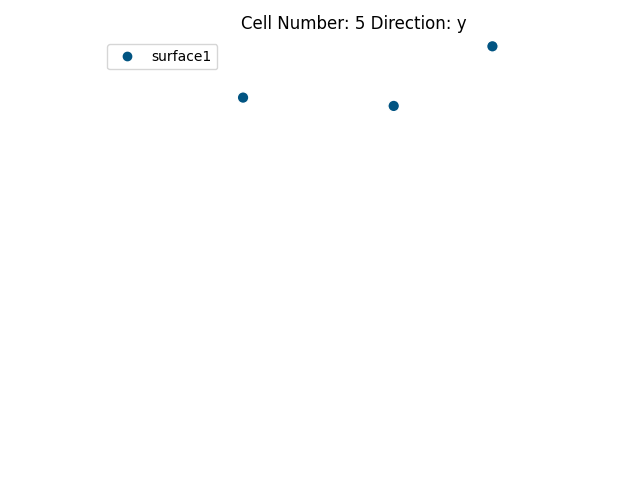
<gempy_viewer.modules.plot_3d.vista.GemPyToVista object at 0x7f08f2195a80>
Update and Recompute Model Transform:
Removing auto anisotropy for this 2.5D model.
geo_model.update_transform(gp.data.GlobalAnisotropy.NONE)
Interpolation:
With the provided data, we can now interpolate the 3D surface.
gp.compute_model(geo_model, engine_config=gp.data.GemPyEngineConfig())
Setting Backend To: AvailableBackends.numpy
/home/leguark/gempy/gempy/core/data/geo_model.py:164: UserWarning: You are using refinement and passing a regular grid. The resolution of the regular grid will be overwritten
  warnings.warn(
Display interpolation kernel options:
geo_model.interpolation_options.kernel_options
Visualization:
Interpolated 3D surface can be visualized both in 2D and 3D.
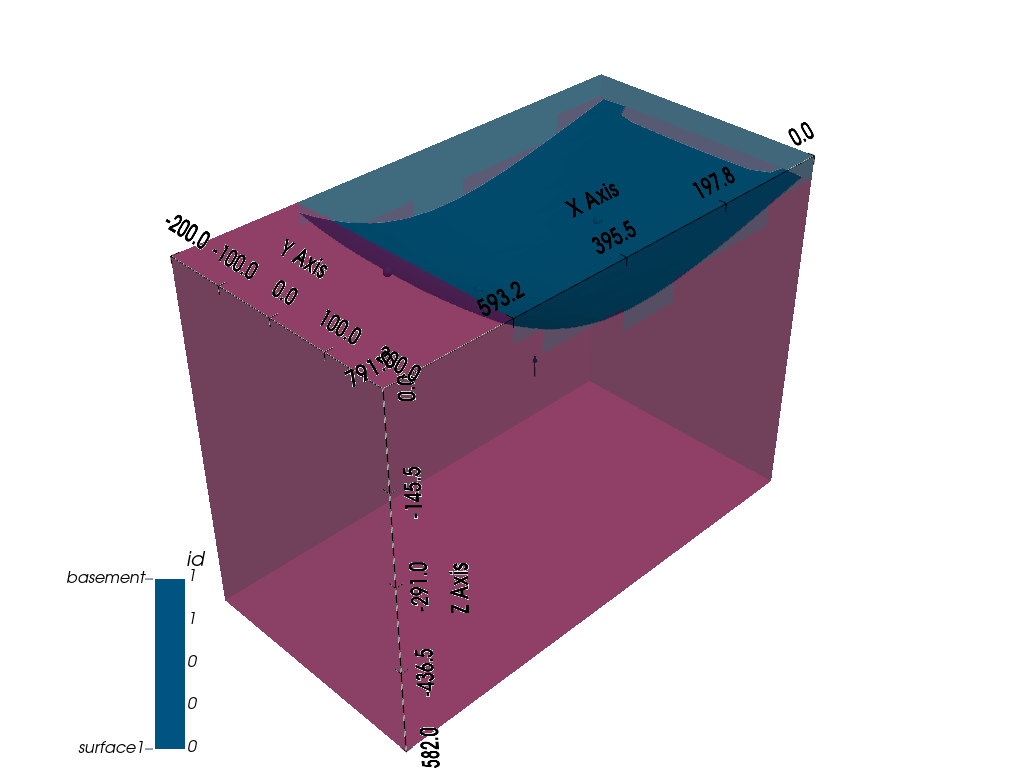
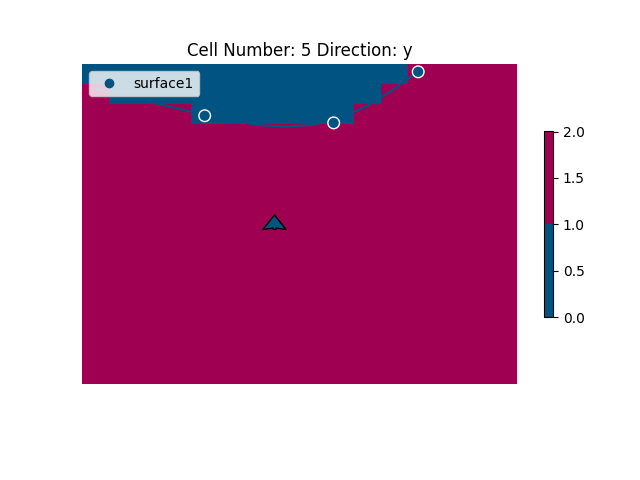
<gempy_viewer.modules.plot_3d.vista.GemPyToVista object at 0x7f08f2084b50>
Expanding the Model with More Layers:
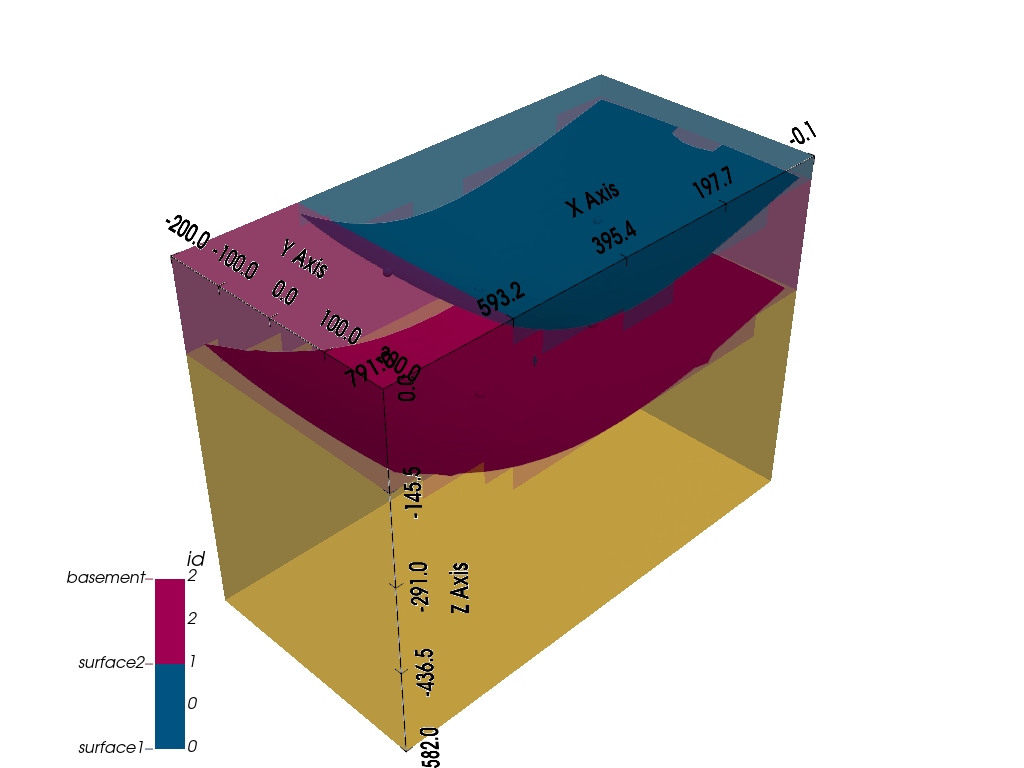
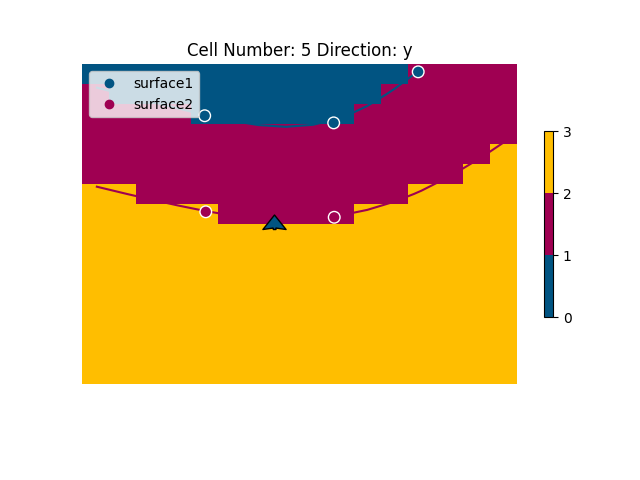
Our cross-section image displays 4 layers, yet we only defined 2. Let’s add two more.
# Display current structural frame:
geo_model.structural_frame
Defining Layer 2:
Adding points and properties for the next layer.
element2 = gp.data.StructuralElement(
    name='surface2',
    color=next(geo_model.structural_frame.color_generator),
    surface_points=gp.data.SurfacePointsTable.from_arrays(
        x=np.array([225, 459]),
        y=np.array([0, 0]),
        z=np.array([-269, -279]),
        names='surface2'
    ),
    orientations=gp.data.OrientationsTable.initialize_empty()
)

geo_model.structural_frame.structural_groups[0].append_element(element2)

# Compute and visualize the updated model:
gp.compute_model(geo_model)
gpv.plot_2d(geo_model, cell_number=5, legend='force')
gpv.plot_3d(geo_model, image=True)
Setting Backend To: AvailableBackends.numpy

<gempy_viewer.modules.plot_3d.vista.GemPyToVista object at 0x7f08f521ba00>
Defining Layer 3:
Adding points and properties for another layer.
element3 = gp.data.StructuralElement(
    name='surface3',
    color=next(geo_model.structural_frame.color_generator),
    surface_points=gp.data.SurfacePointsTable.from_arrays(
        x=np.array([225, 464, 619]),
        y=np.array([0, 0, 0]),
        z=np.array([-439, -456, -433]),
        names='surface3'
    ),
    orientations=gp.data.OrientationsTable.initialize_empty()
)

geo_model.structural_frame.structural_groups[0].append_element(element3)

# Compute and visualize with adjusted parameters:
gp.compute_model(geo_model)
gpv.plot_2d(geo_model, cell_number=5, legend='force')
gpv.plot_3d(geo_model, kwargs_plot_structured_grid={'opacity': .2}, image=True)
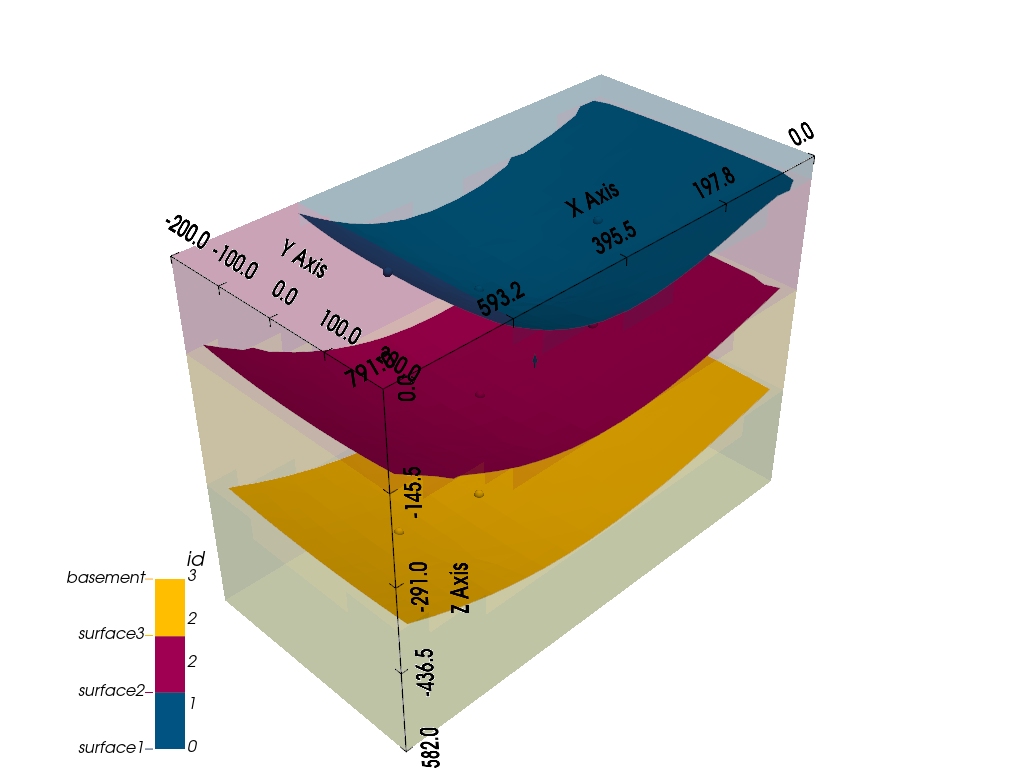
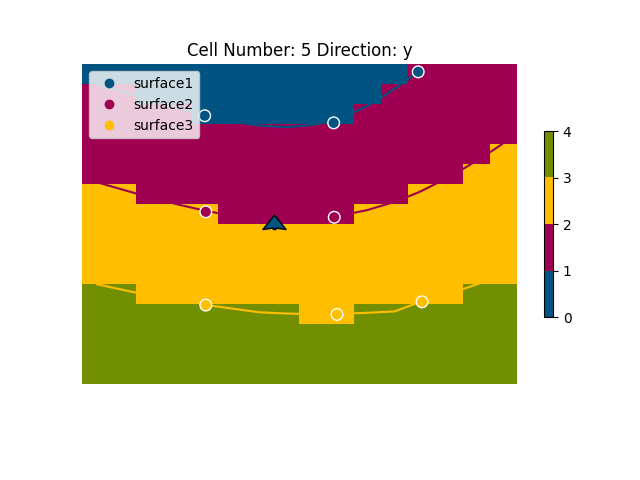
Setting Backend To: AvailableBackends.numpy

<gempy_viewer.modules.plot_3d.vista.GemPyToVista object at 0x7f08f50fff10>
Adding a Fault:
To date, our model represents a simple depositional unit. With GemPy, we can incorporate unconformities and faults for more intricate models. Relationships are depicted as: input data (surface points/ orientations) <belong to< surface <belong to< series. Here, we’ll add a fault as a demonstration.
Add the fault’s input data:
element_fault = gp.data.StructuralElement(
    name='fault1',
    color=next(geo_model.structural_frame.color_generator),
    surface_points=gp.data.SurfacePointsTable.from_arrays(
        x=np.array([550, 650]),
        y=np.array([0, 0]),
        z=np.array([-30, -200]),
        names='fault1'
    ),
    orientations=gp.data.OrientationsTable.from_arrays(
        x=np.array([600]),
        y=np.array([0]),
        z=np.array([-100]),
        G_x=np.array([.3]),
        G_y=np.array([0]),
        G_z=np.array([.3]),
        names='fault1'
    )
)

group_fault = gp.data.StructuralGroup(
    name='Fault1',
    elements=[element_fault],
    structural_relation=gp.data.StackRelationType.FAULT,
    fault_relations=gp.data.FaultsRelationSpecialCase.OFFSET_ALL
)

# Insert the fault group into the structural frame:
geo_model.structural_frame.insert_group(0, group_fault)

# Preview the model's input data:
gpv.plot_2d(geo_model, show_results=False)
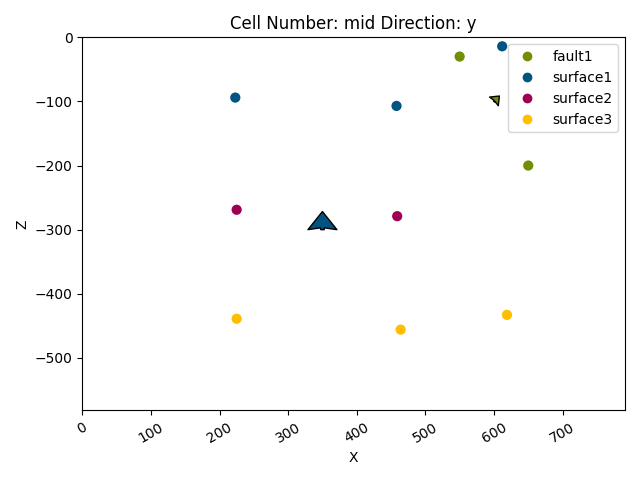
<gempy_viewer.modules.plot_2d.visualization_2d.Plot2D object at 0x7f08f5173940>
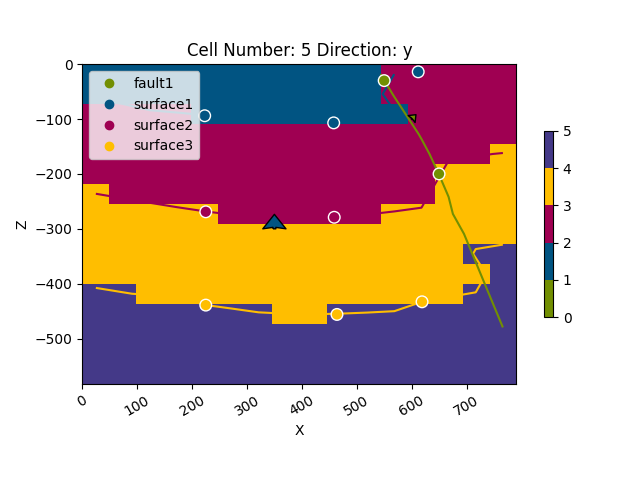
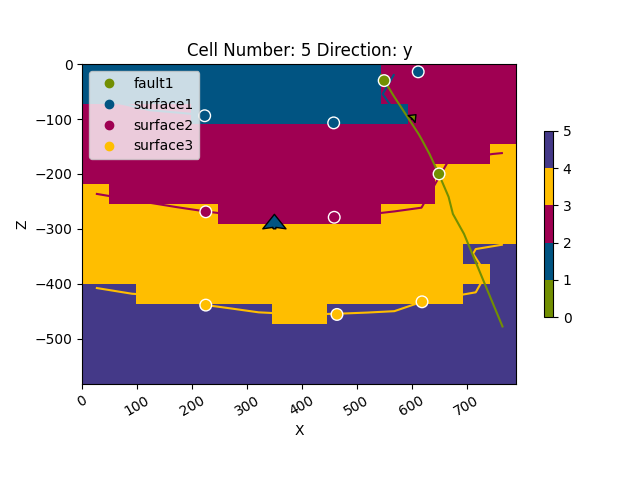
Compute and visualize the updated model:
gp.compute_model(geo_model)
gpv.plot_2d(geo_model, cell_number=5, legend='force')
gpv.plot_3d(geo_model, kwargs_plot_structured_grid={'opacity': .2})
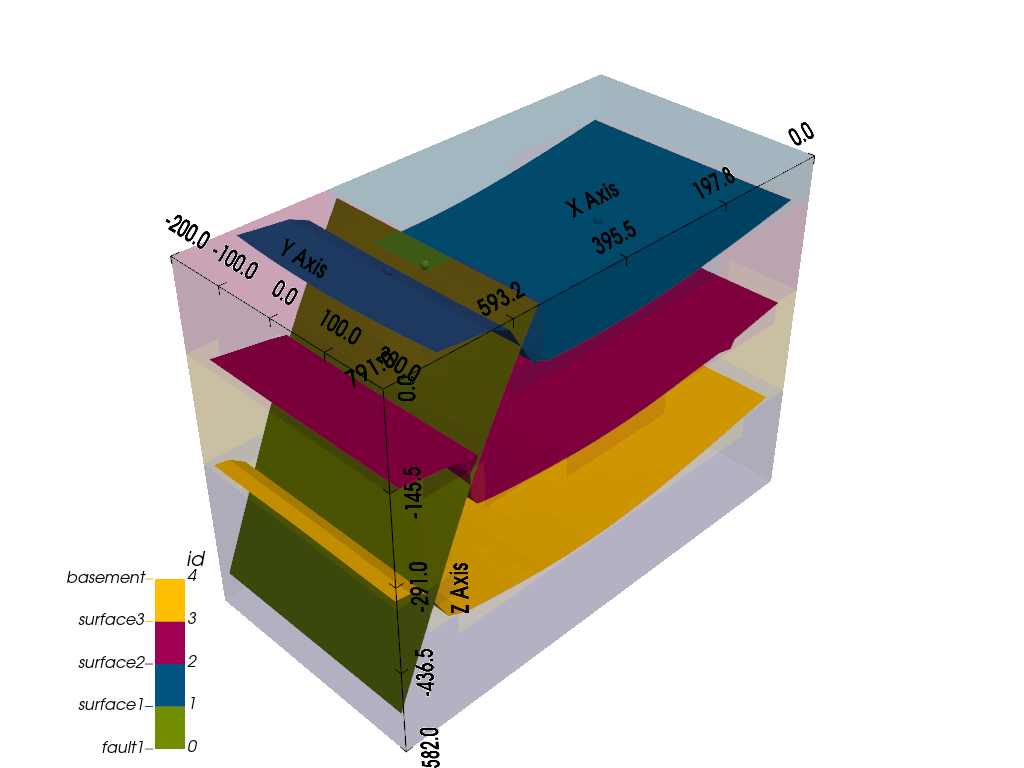
Setting Backend To: AvailableBackends.numpy

<gempy_viewer.modules.plot_3d.vista.GemPyToVista object at 0x7f08f1fe7730>
Advanced Features:
Over time, numerous capabilities have been integrated with GemPy. Here, we’ll showcase a few of them.
# Topography:
# GemPy offers built-in tools to manage topographic data through gdal.
# For demonstration, we'll create a random topography:

gp.set_topography_from_random(
    grid=geo_model.grid,
    fractal_dimension=1.9,
    d_z=np.array([-150, 0]),
    topography_resolution=np.array([200, 200])
)

# Visualize the topography:
gpv.plot_2d(geo_model, cell_number=5, legend='force')
gpv.plot_3d(geo_model, kwargs_plot_structured_grid={'opacity': .2})

# Calculate and visualize the area's geological map:
gp.compute_model(geo_model)
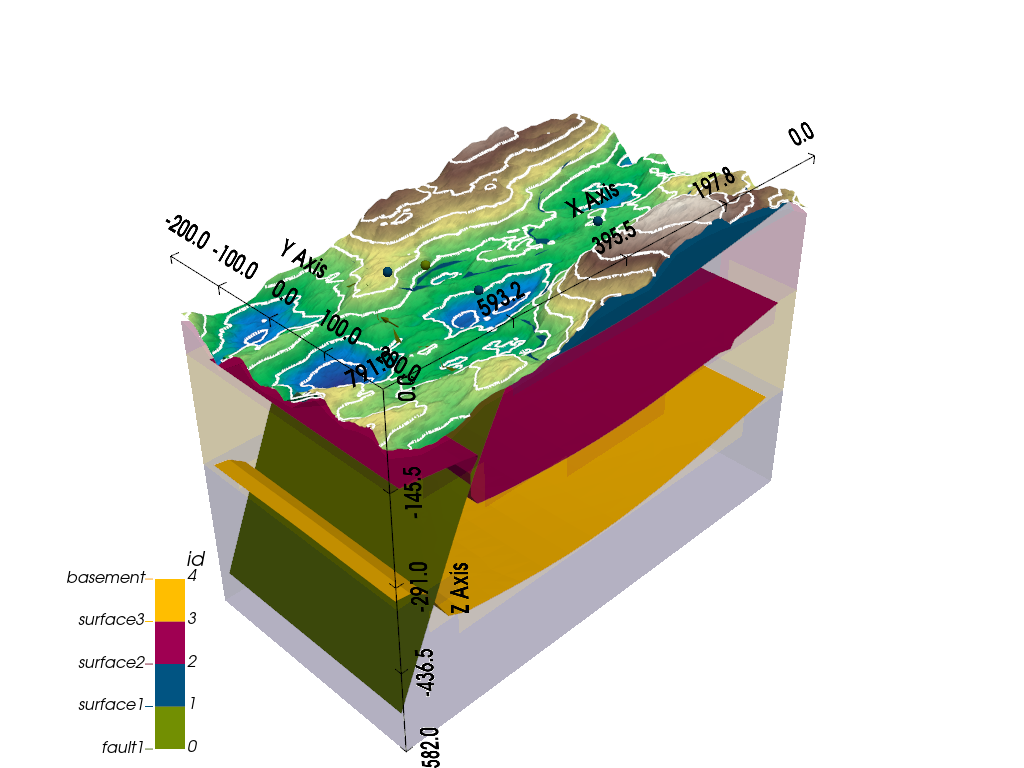
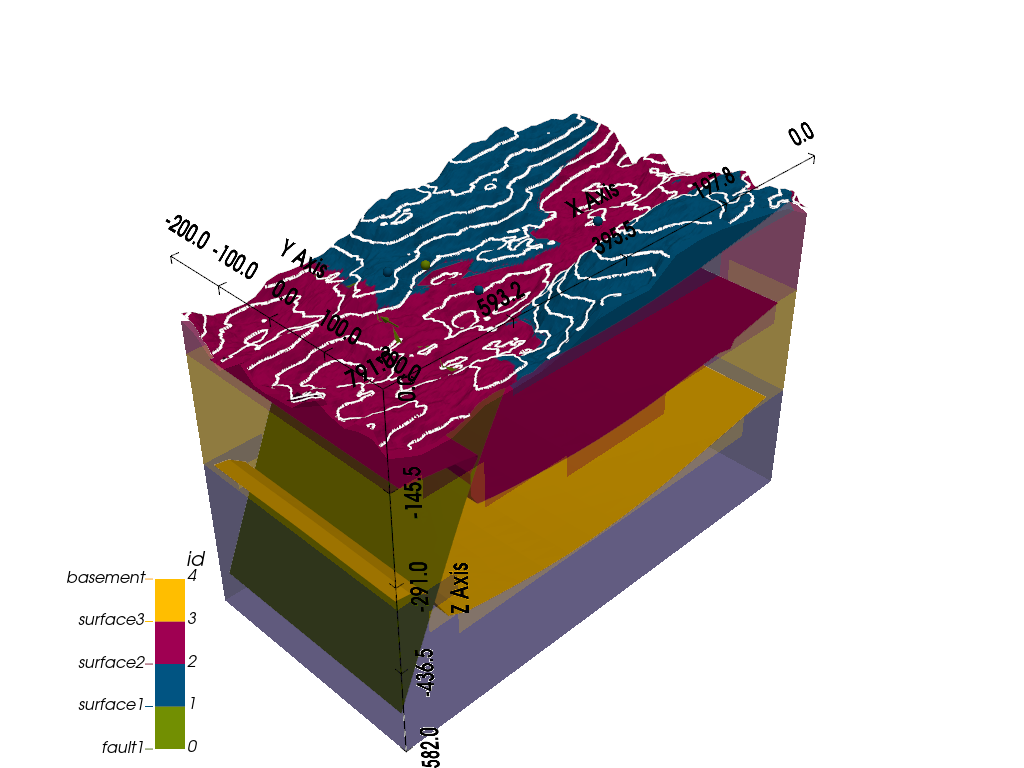
gpv.plot_3d(geo_model, show_topography=True)
Active grids: ['topography']
Setting Backend To: AvailableBackends.numpy

<gempy_viewer.modules.plot_3d.vista.GemPyToVista object at 0x7f08f1f6eda0>
Coming soon: Gravity inversion
This feature is not yet available in the current version of GemPy.
Assign density values to model units: geo_model.add_surface_values([0, 2.6, 2.4, 3.2, 3.6], [‘density’])
Generate a centered grid around a device for improved accuracy: geo_model.set_centered_grid(centers=[[400, 0, 0]], resolution=[10, 10, 100], radius=800)
Adjust the compile code for gravity computation: gp.set_interpolator(geo_model, output=[‘gravity’], aesara_optimizer=’fast_run’)
Besides the interpolation, compute the model’s forward gravity: gp.compute_model(geo_model) geo_model.solutions.fw_gravity
sphinx_gallery_thumbnail_number = -2
Total running time of the script: (0 minutes 5.821 seconds)
