Note
Go to the end to download the full example code
1.6: 2D Visualization.
import os

# Importing auxiliary libraries
import numpy as np

# Importing GemPy
import gempy as gp
import gempy_viewer as gpv

# sphinx_gallery_thumbnail_number = -1

np.random.seed(1515)
Model interpolation
Data Preparation
data_path = os.path.abspath('../../')

geo_data: gp.data.GeoModel = gp.create_geomodel(
    project_name='viz_2d',
    extent=[0, 1000, 0, 1000, 0, 1000],
    resolution=[10, 10, 10],
    refinement=4,
    importer_helper=gp.data.ImporterHelper(
        path_to_orientations=data_path + "/data/input_data/jan_models/model5_orientations.csv",
        path_to_surface_points=data_path + "/data/input_data/jan_models/model5_surface_points.csv",
    )
)

gp.set_topography_from_random(grid=geo_data.grid, d_z=np.array([500, 1000]))
Active grids: ['topography']

<gempy.core.data.grid_modules.topography.Topography object at 0x7f08f5695540>
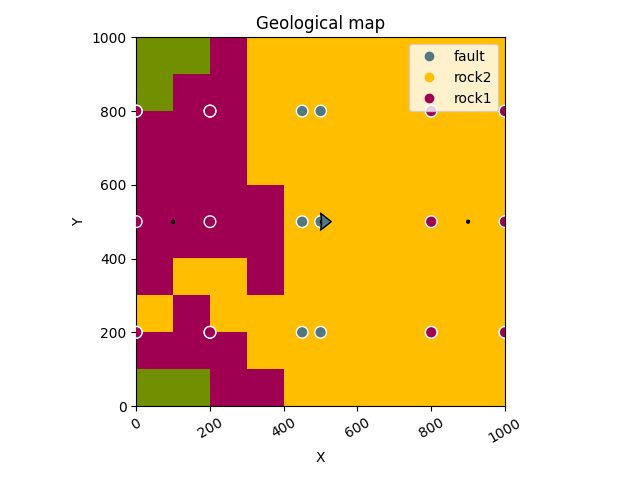
gpv.plot_2d(geo_data)
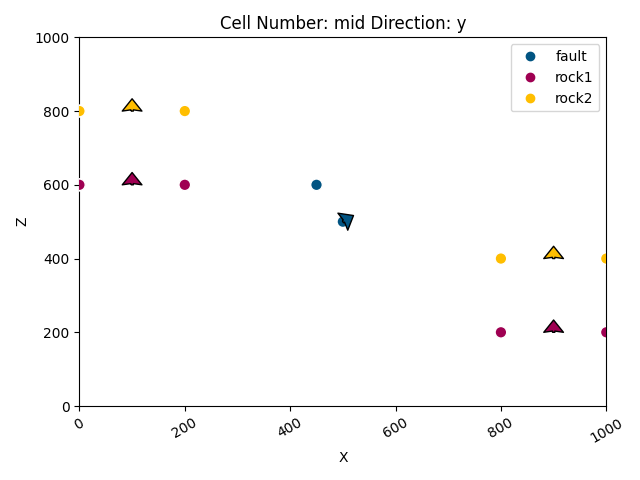
<gempy_viewer.modules.plot_2d.visualization_2d.Plot2D object at 0x7f08f5695240>
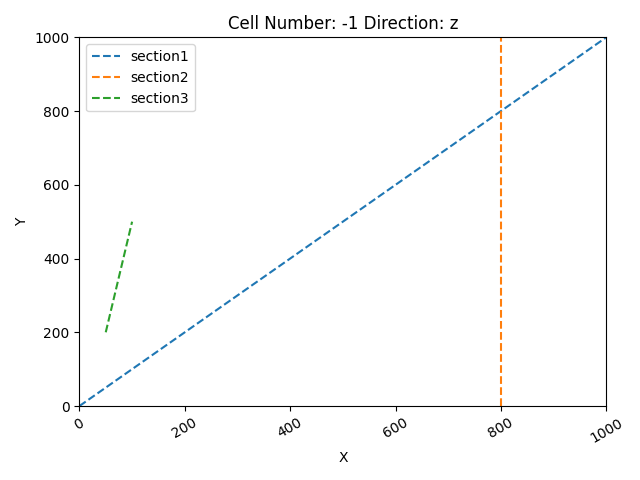
section_dict = {'section1': ([0, 0], [1000, 1000], [100, 80]),
                'section2': ([800, 0], [800, 1000], [150, 100]),
                'section3': ([50, 200], [100, 500], [200, 150])}
gp.set_section_grid(geo_data.grid, section_dict)
gpv.plot_section_traces(geo_data)
Active grids: ['topography' 'sections']

<function plot_section_traces at 0x7f08fe6e30a0>
geo_data.grid.sections
gp.map_stack_to_surfaces(
    gempy_model=geo_data,
    mapping_object={
        "Fault_Series": 'fault',
        "Strat_Series": ('rock2', 'rock1')
    }
)

gp.set_is_fault(
    frame=geo_data.structural_frame,
    fault_groups=['Fault_Series']
)
geo_data.grid.active_grids
array(['topography', 'sections'], dtype='<U10')
Setting Backend To: AvailableBackends.numpy
/home/leguark/gempy/gempy/core/data/geo_model.py:164: UserWarning: You are using refinement and passing a regular grid. The resolution of the regular grid will be overwritten
  warnings.warn(
new plotting api
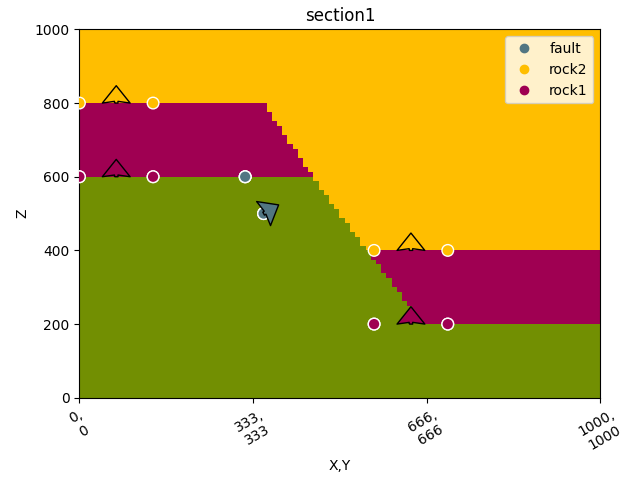
gpv.plot_2d(geo_data, section_names=['section1'])
/home/leguark/gempy_viewer/gempy_viewer/API/_plot_2d_sections_api.py:106: UserWarning: Section contacts not implemented yet. We need to pass scalar field for the sections grid
  warnings.warn(

<gempy_viewer.modules.plot_2d.visualization_2d.Plot2D object at 0x7f08f567cc10>
Plot API
If nothing is passed, a Plot2D object is created and therefore you are in the same situation as above:
p3 = gpv.plot_2d(geo_data)
Alternatively you can pass section_names, cell_numbers + direction or any combination of the above:
gpv.plot_2d(geo_data, section_names=['topography'])
/home/leguark/gempy_viewer/gempy_viewer/API/_plot_2d_sections_api.py:106: UserWarning: Section contacts not implemented yet. We need to pass scalar field for the sections grid
  warnings.warn(

<gempy_viewer.modules.plot_2d.visualization_2d.Plot2D object at 0x7f08f21b93f0>
gpv.plot_2d(geo_data, section_names=['section1'])

/home/leguark/gempy_viewer/gempy_viewer/API/_plot_2d_sections_api.py:106: UserWarning: Section contacts not implemented yet. We need to pass scalar field for the sections grid
  warnings.warn(

<gempy_viewer.modules.plot_2d.visualization_2d.Plot2D object at 0x7f08ac81a740>
gpv.plot_2d(geo_data, section_names=['section1', 'section2'])
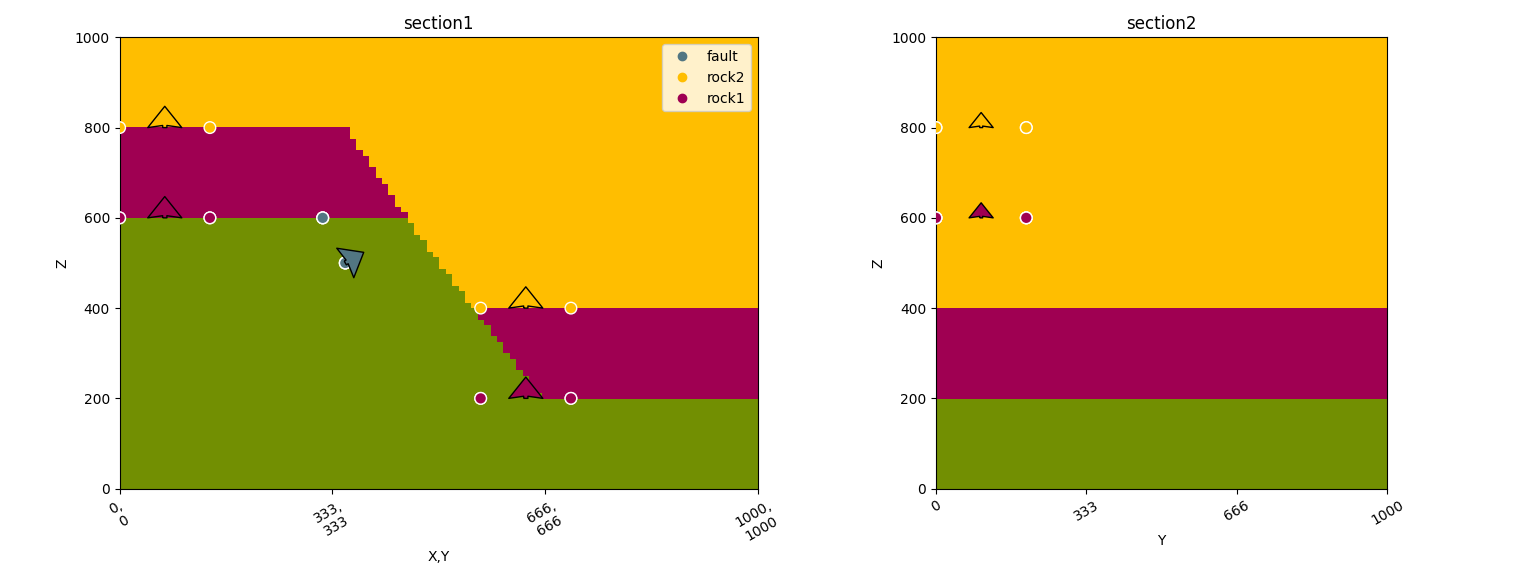
/home/leguark/gempy_viewer/gempy_viewer/API/_plot_2d_sections_api.py:106: UserWarning: Section contacts not implemented yet. We need to pass scalar field for the sections grid
  warnings.warn(

<gempy_viewer.modules.plot_2d.visualization_2d.Plot2D object at 0x7f08ac7f86d0>
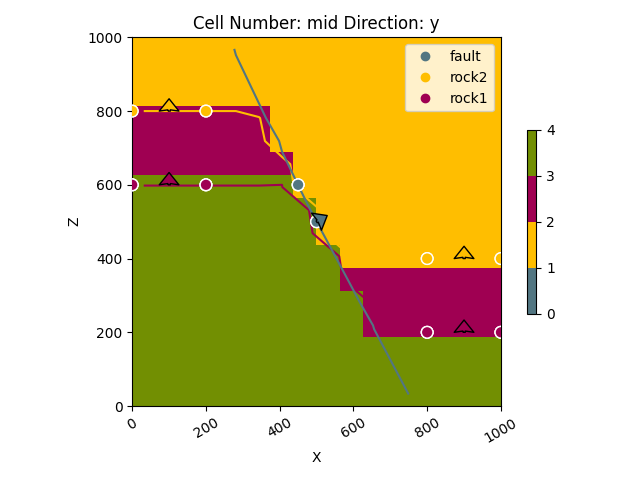
gpv.plot_2d(geo_data, figsize=(15, 15), section_names=['section1', 'section2', 'topography'], cell_number='mid')
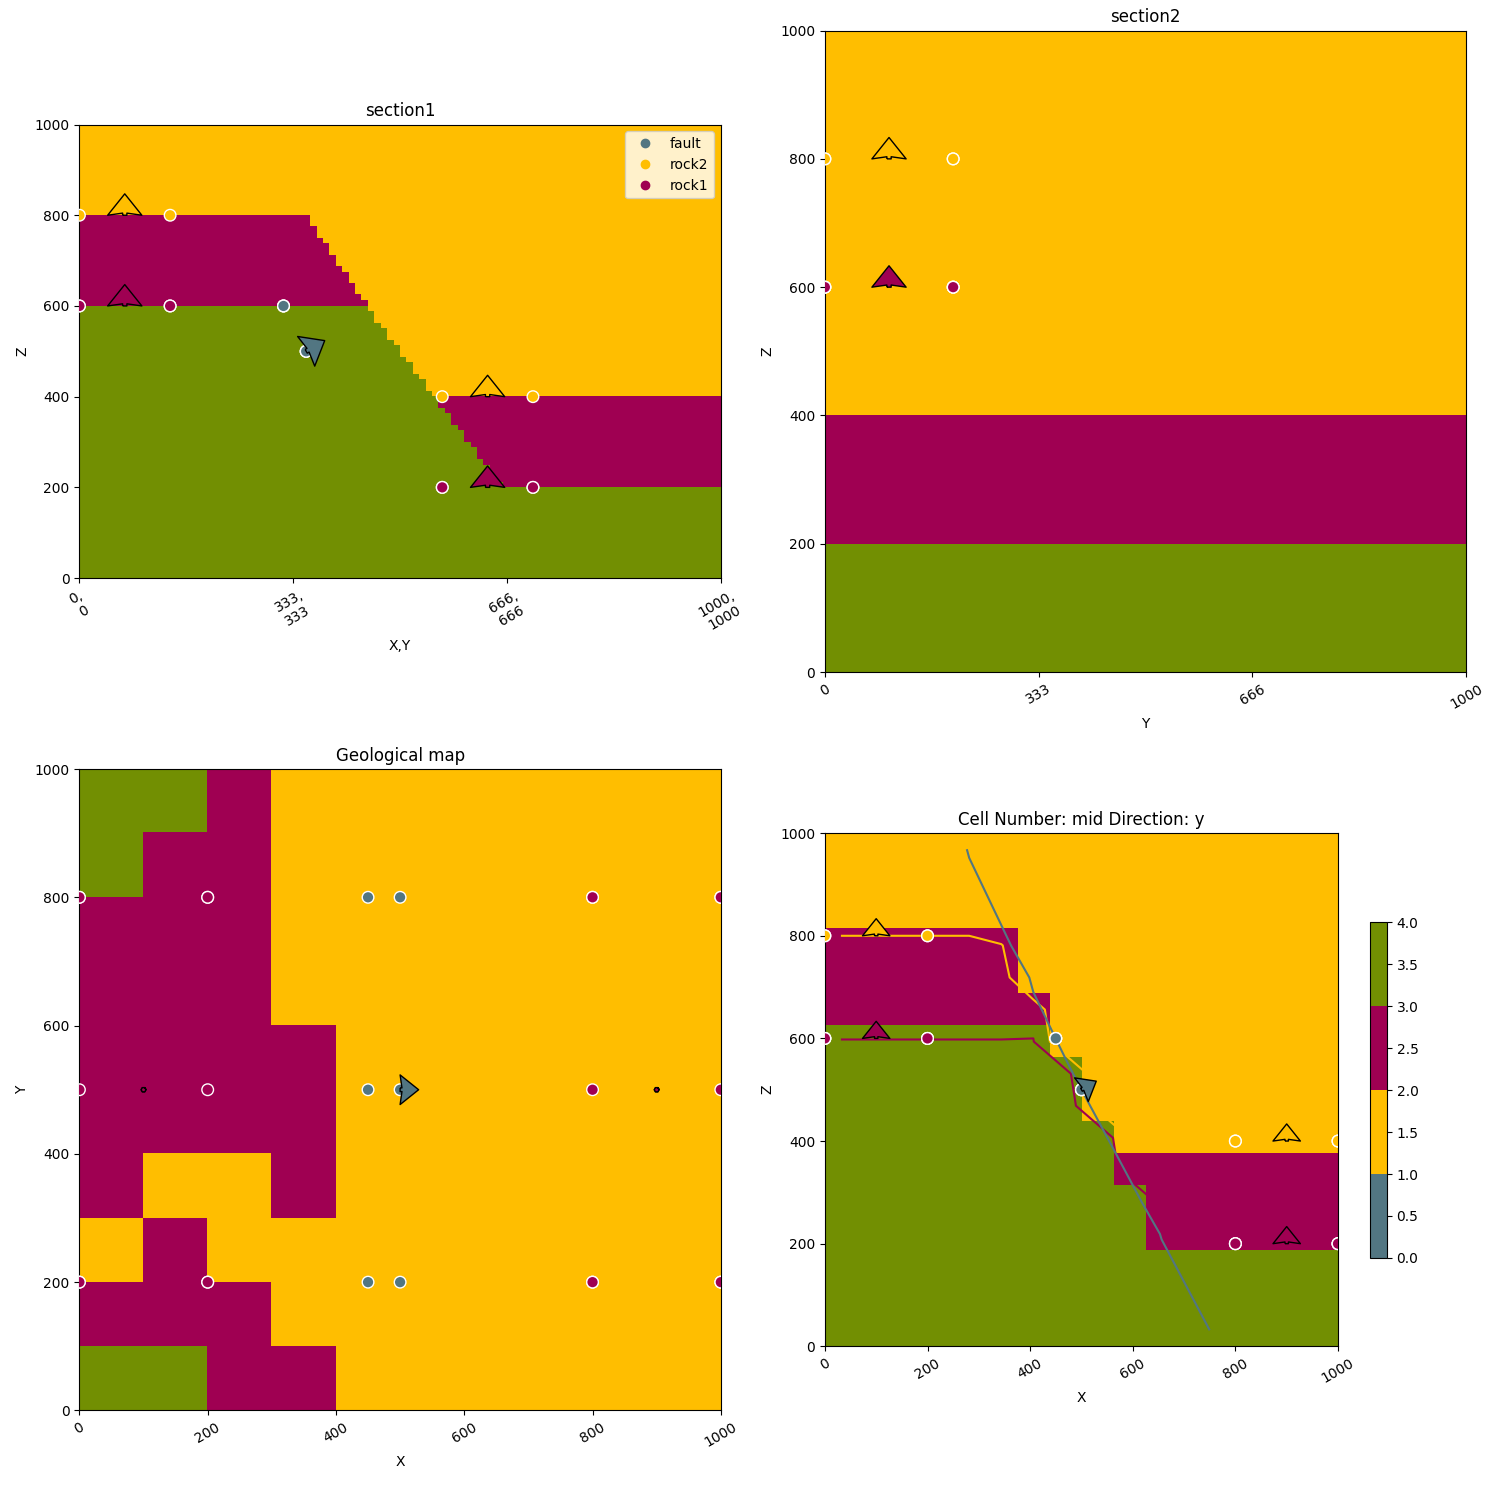
/home/leguark/gempy_viewer/gempy_viewer/API/_plot_2d_sections_api.py:106: UserWarning: Section contacts not implemented yet. We need to pass scalar field for the sections grid
  warnings.warn(

<gempy_viewer.modules.plot_2d.visualization_2d.Plot2D object at 0x7f08f567cc10>
Total running time of the script: (0 minutes 2.381 seconds)