Note
Click here to download the full example code
1.5: Fault relations
Importing gempy
import gempy as gp

# Aux imports
import numpy as np
import pandas as pd
import os

# Importing the function to find the interface
from gempy.utils.input_manipulation import find_interfaces_from_block_bottoms
import matplotlib.pyplot as plt

np.random.seed(1515)
pd.set_option('precision', 2)
We import a model from an existing folder.
Out:
Active grids: ['regular']
Setting kriging parameters to their default values.
Compiling theano function...
Level of Optimization:  fast_compile
Device:  cpu
Precision:  float64
Number of faults:  1
Compilation Done!
Kriging values:
                        values
range                 1732.05
$C_o$                71428.57
drift equations  [3, 3, 3, 3]
nugget grad              0.01
nugget scalar             0.0
gp.compute_model(geo_model, compute_mesh=False)
Out:
Lithology ids
  [7. 7. 7. ... 2. 2. 2.]
Out:
array([7., 7., 7., ..., 2., 2., 2.])
Out:
array([[2., 2., 2., ..., 1., 1., 1.]])
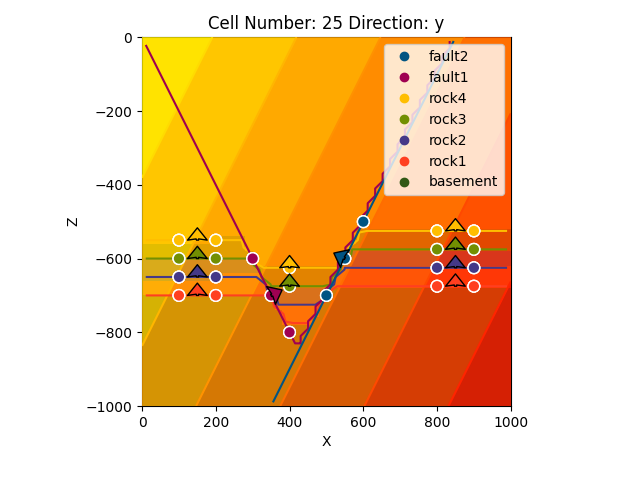
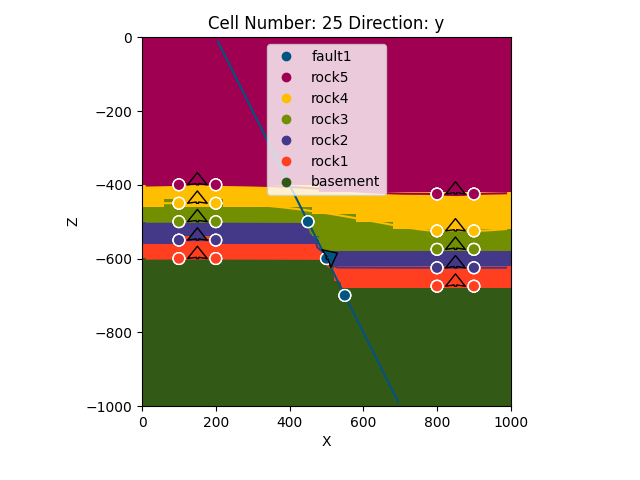
gp.plot_2d(geo_model, cell_number=[25], show_data=True)

# Graben example
# --------------
Out:
<gempy.plot.visualization_2d.Plot2D object at 0x7fcc46605610>
geo_model_graben = gp.load_model(r'Tutorial_ch1-9b_Fault_relations',
                                 path=data_path + 'data/gempy_models/Tutorial_ch1-9b_Fault_relations', recompile=True)

geo_model.meta.project_name = "Faults_relations"
Out:
Active grids: ['regular']
Setting kriging parameters to their default values.
Compiling theano function...
Level of Optimization:  fast_compile
Device:  cpu
Precision:  float64
Number of faults:  2
Compilation Done!
Kriging values:
                        values
range                 1732.05
$C_o$                71428.57
drift equations  [3, 3, 3, 3]
nugget grad              0.01
nugget scalar             0.0
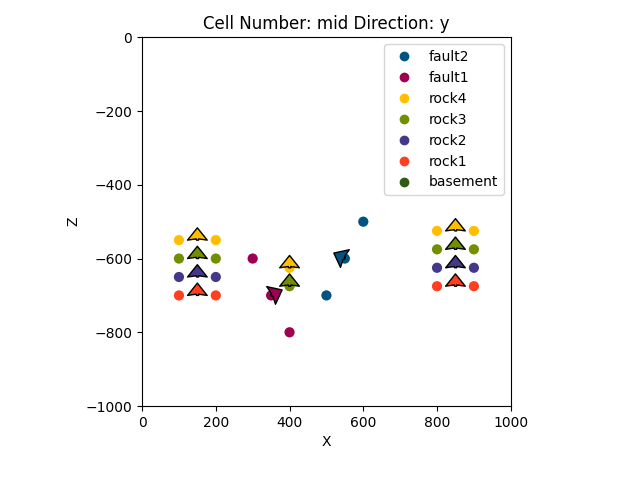
Displaying the input data:
gp.plot_2d(geo_model_graben, direction='y')
Out:
<gempy.plot.visualization_2d.Plot2D object at 0x7fcb8a4c3790>
gp.plot_2d(geo_model_graben, direction='x')
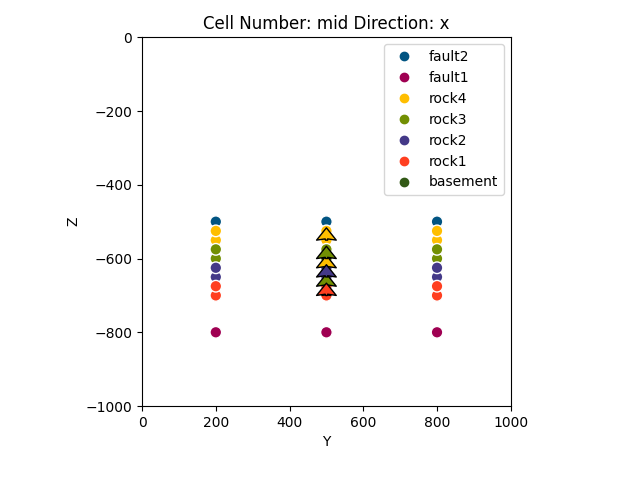
Out:
<gempy.plot.visualization_2d.Plot2D object at 0x7fcc46088280>
Out:
Lithology ids
  [7. 7. 7. ... 3. 3. 3.]
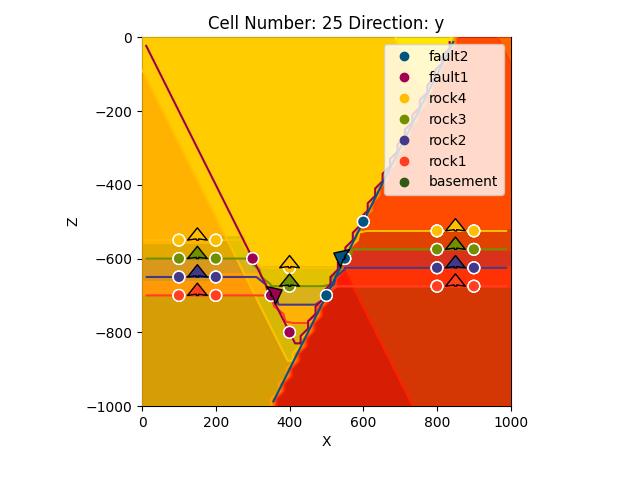
gp.plot_2d(geo_model_graben, cell_number=[25], show_data=True)
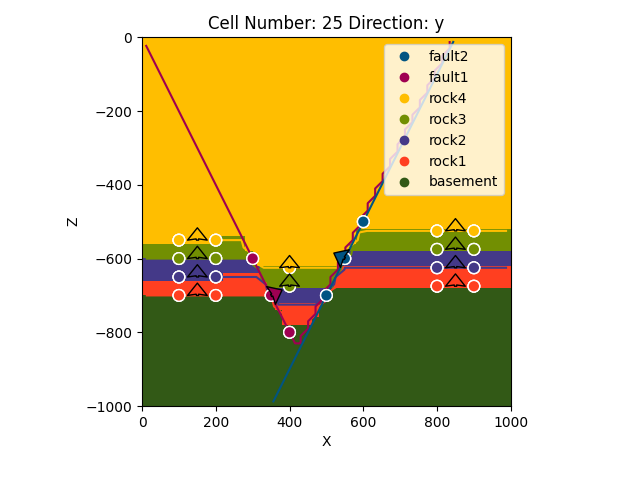
Out:
<gempy.plot.visualization_2d.Plot2D object at 0x7fcb8bfbf1f0>
sphinx_gallery_thumbnail_number = 5
gp.plot_3d(geo_model_graben, image=True)
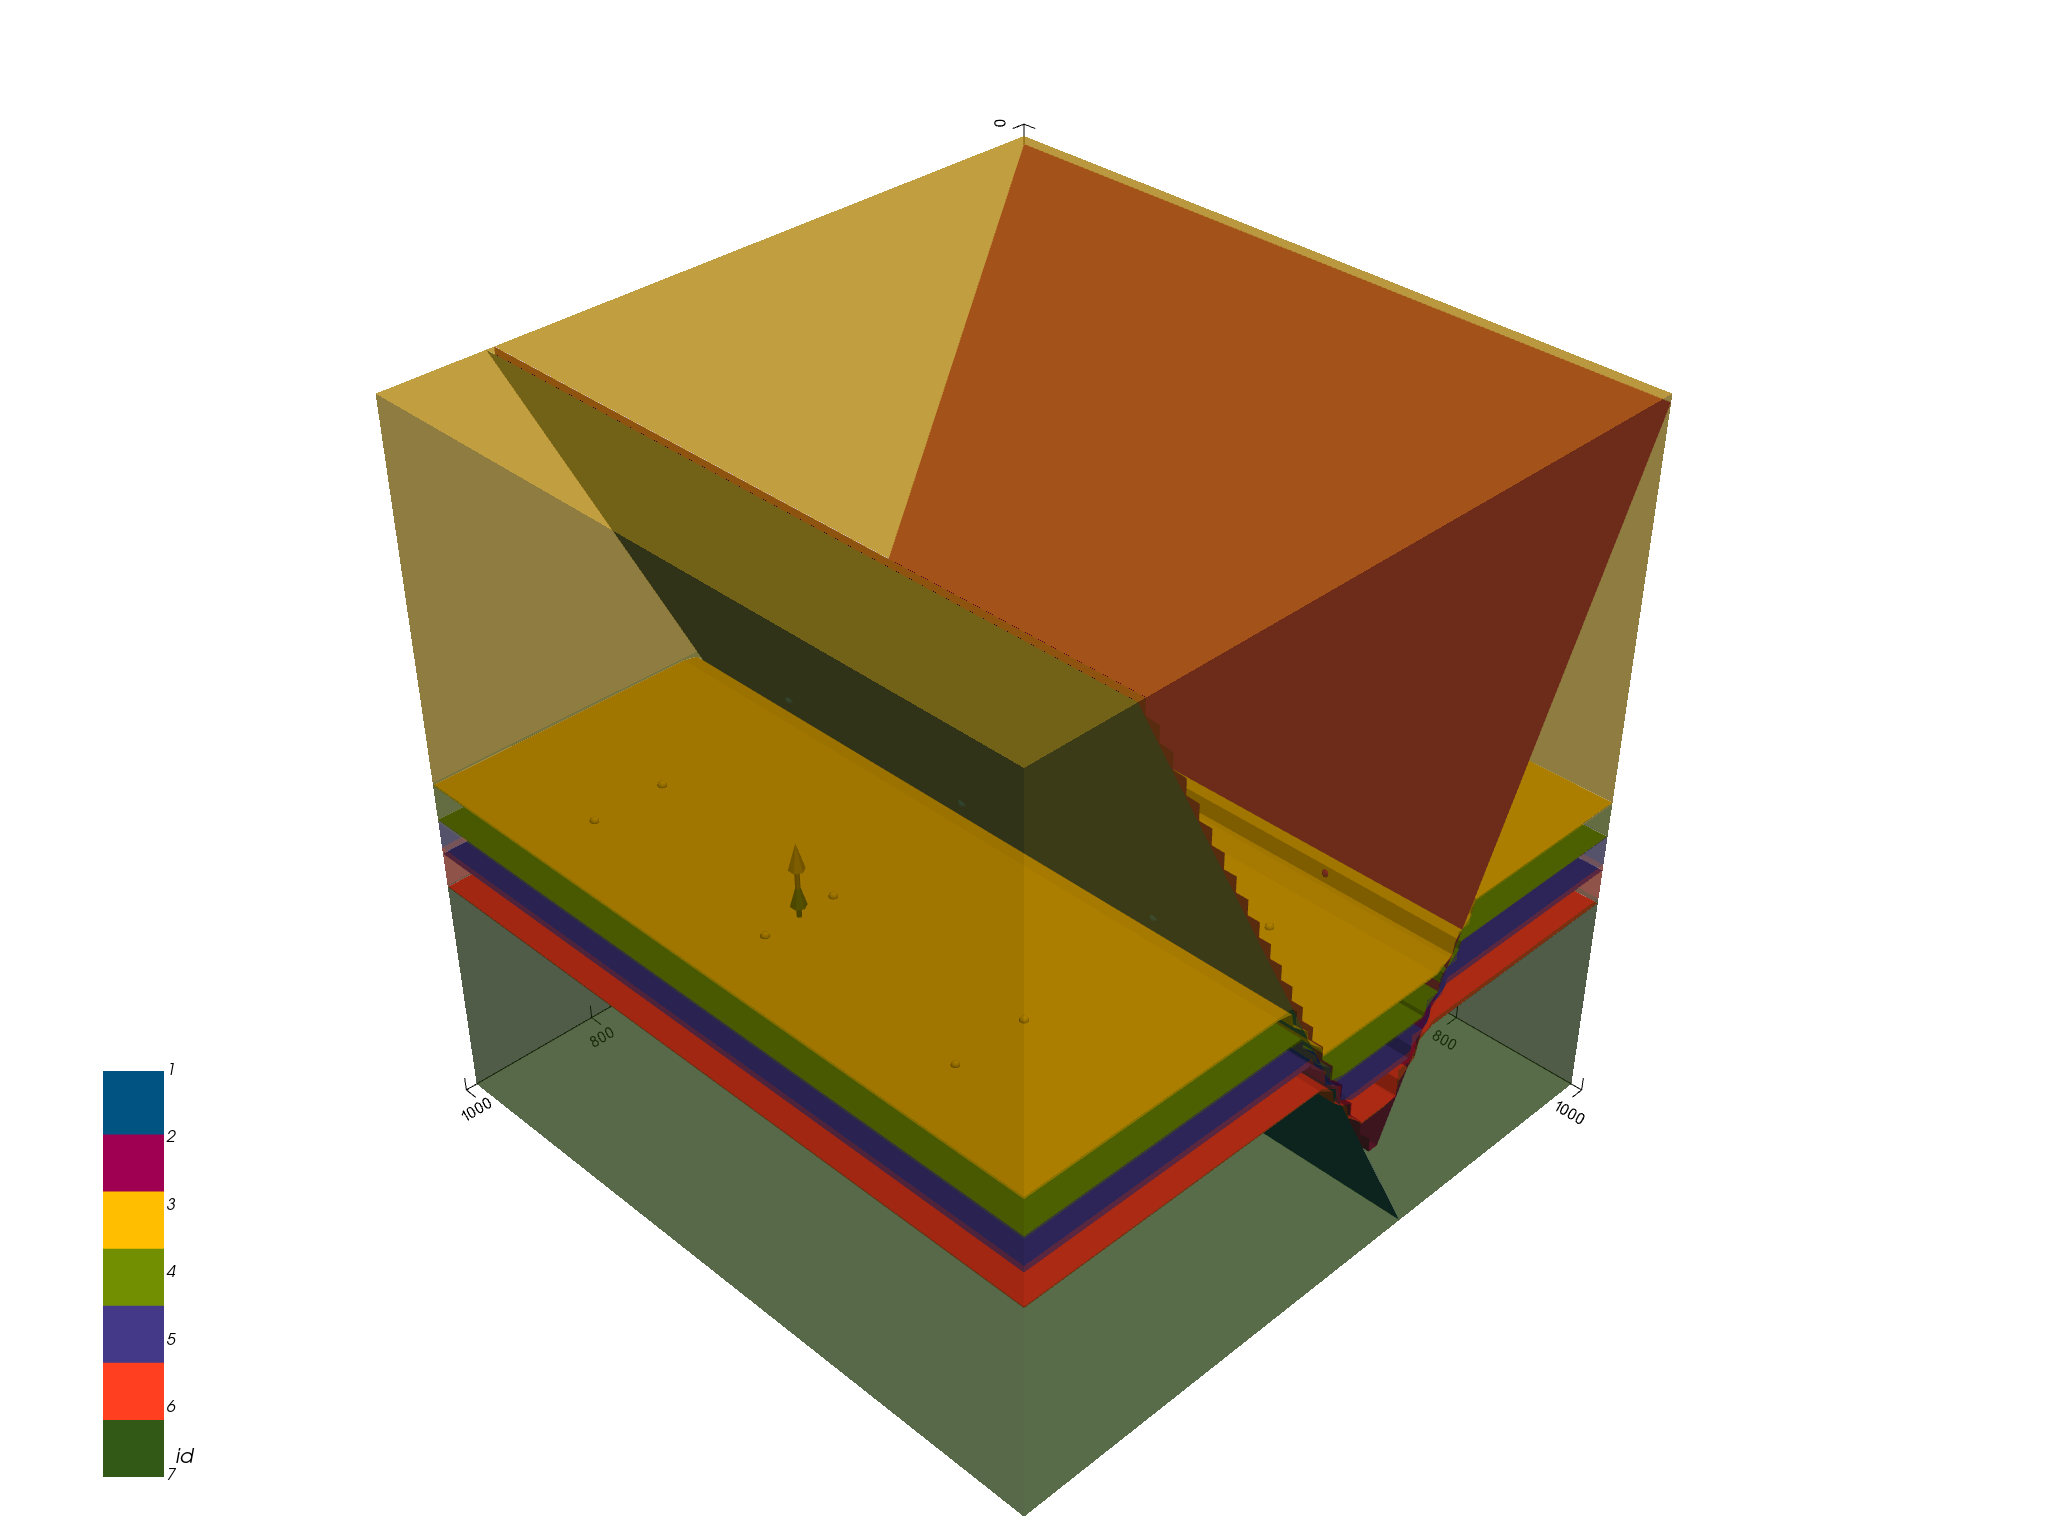
Out:
<gempy.plot.vista.GemPyToVista object at 0x7fcbe004be50>
gp.plot_2d(geo_model_graben, cell_number=[25], show_scalar=True, series_n=0)

gp.plot_2d(geo_model_graben, cell_number=[25], show_scalar=True, series_n=1)
Out:
<gempy.plot.visualization_2d.Plot2D object at 0x7fcc418c5220>
Offset parameter (Experimental)
geo_model_graben._interpolator.theano_graph.offset.set_value(1)
gp.compute_model(geo_model_graben, compute_mesh=False)
Out:
Lithology ids
  [7. 7. 7. ... 3. 3. 3.]
gp.plot_2d(geo_model_graben, block=geo_model_graben.solutions.block_matrix[1, 0, :125000],
           show_data=True)
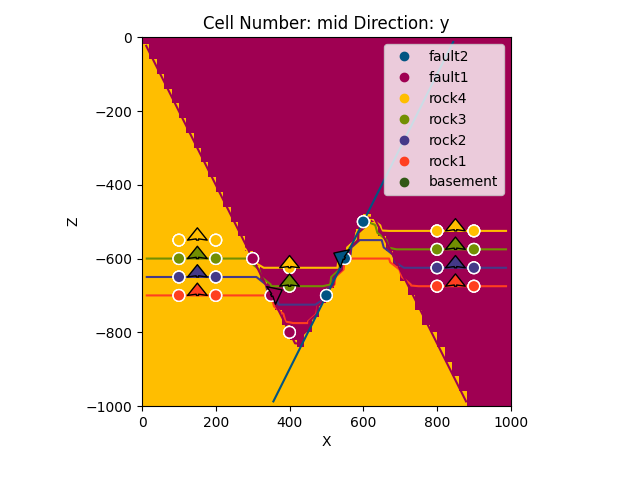
Out:
<gempy.plot.visualization_2d.Plot2D object at 0x7fcc6b9bc9d0>
gp.plot_2d(geo_model_graben, series_n=2, show_scalar=True)
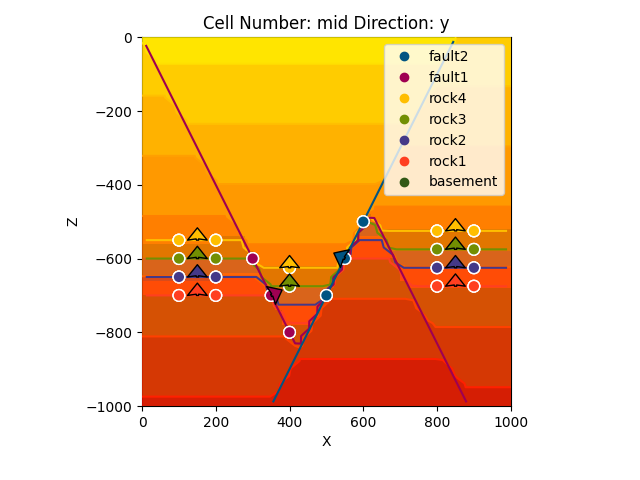
Out:
<gempy.plot.visualization_2d.Plot2D object at 0x7fcc46ee3ca0>
Out:
array([0.17363373, 0.1848186 , 0.19600352, ..., 1.36450254, 1.37569005,
       1.38687763])
Finding the faults intersection:
Sometimes we need to find the voxels that contain the each fault. To do so we can use gempy’s functionality to find interfaces as follows. Lets use the first fault as an example:
gp.plot_2d(geo_model_graben,
           regular_grid=geo_model_graben.solutions.block_matrix[0, 0, :125000],
           show_data=True)
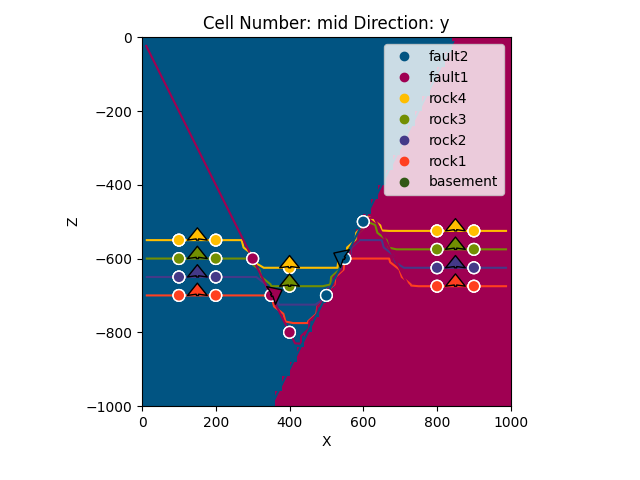
Out:
<gempy.plot.visualization_2d.Plot2D object at 0x7fcb8a4d44c0>
Remember the fault block is stored on:
geo_model_graben.solutions.block_matrix[0, 0, :125000]
Out:
array([1., 1., 1., ..., 2., 2., 2.])
Now we can find where is the intersection of the values 1 by calling the following function. This will return Trues on those voxels on the intersection
intersection = find_interfaces_from_block_bottoms(
    geo_model_graben.solutions.block_matrix[0, 0, :125000].reshape(50, 50, 50), 1, shift=1)
We can manually plotting together to see exactly what we have done
ax = gp.plot_2d(geo_model_graben,
                block=geo_model_graben.solutions.block_matrix[0, 0, :125000],
                show_data=True, show=False)

plt.imshow(intersection[:, 25, :].T, origin='lower', extent=(0, 1000, -1000, 0), alpha=.5)
plt.show()

gp.save_model(geo_model)
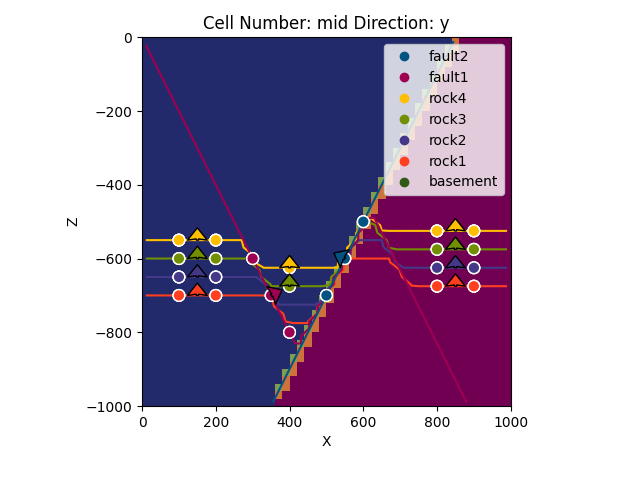
Out:
True
Total running time of the script: ( 0 minutes 19.931 seconds)
