Note
Click here to download the full example code
1.6: 2D Visualization.
# Importing GemPy
import gempy as gp

# Importing auxiliary libraries
import numpy as np
import pandas as pd
import matplotlib.pyplot as plt

np.random.seed(1515)
pd.set_option('precision', 2)
Model interpolation
Data Preparation
data_path = 'https://raw.githubusercontent.com/cgre-aachen/gempy_data/master/'

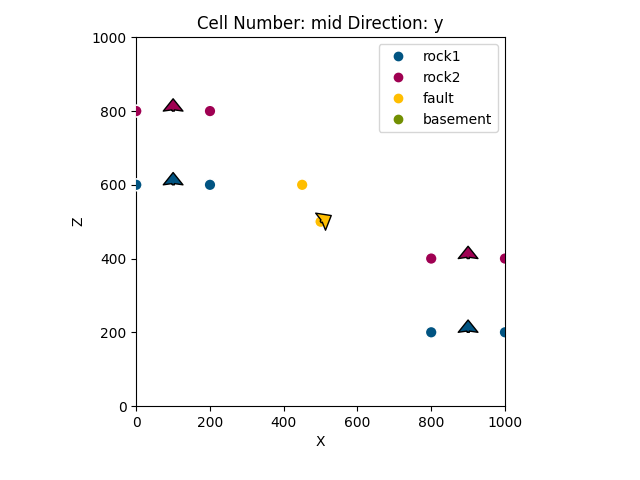
geo_data = gp.create_data('viz_2d', [0, 1000, 0, 1000, 0, 1000], resolution=[10, 10, 10],
                          path_o=data_path + "/data/input_data/jan_models/model5_orientations.csv",
                          path_i=data_path + "/data/input_data/jan_models/model5_surface_points.csv")
Out:
Active grids: ['regular']
Out:
<gempy.plot.visualization_2d.Plot2D object at 0x7fcb8bab22e0>
geo_data.set_topography(d_z=(500, 1000))
Out:
Active grids: ['regular' 'topography']

Grid Object. Values:
array([[  50.        ,   50.        ,   50.        ],
       [  50.        ,   50.        ,  150.        ],
       [  50.        ,   50.        ,  250.        ],
       ...,
       [1000.        ,  777.77777778,  601.70645773],
       [1000.        ,  888.88888889,  547.79987061],
       [1000.        , 1000.        ,  531.67197073]])
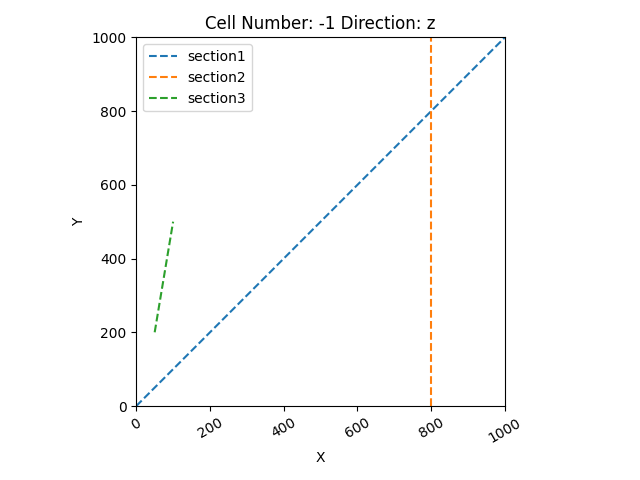
section_dict = {'section1': ([0, 0], [1000, 1000], [100, 80]),
                'section2': ([800, 0], [800, 1000], [150, 100]),
                'section3': ([50, 200], [100, 500], [200, 150])}
geo_data.set_section_grid(section_dict)
gp.plot.plot_section_traces(geo_data)
Out:
Active grids: ['regular' 'topography' 'sections']

<gempy.plot.visualization_2d.Plot2D object at 0x7fcb8912c580>
gp.set_interpolator(geo_data, theano_optimizer='fast_compile')
Out:
Setting kriging parameters to their default values.
Compiling theano function...
Level of Optimization:  fast_compile
Device:  cpu
Precision:  float64
Number of faults:  0
Compilation Done!
Kriging values:
                    values
range             1732.05
$C_o$            71428.57
drift equations    [3, 3]

<gempy.core.interpolator.InterpolatorModel object at 0x7fcc3704b1f0>
gp.map_stack_to_surfaces(geo_data, {"Fault_Series": 'fault',
                                    "Strat_Series": ('rock2', 'rock1')})

geo_data.set_is_fault(['Fault_Series'])
Out:
Fault colors changed. If you do not like this behavior, set change_color to False.
geo_data.get_active_grids()
Out:
array(['regular', 'topography', 'sections'], dtype='<U10')
Out:
/WorkSSD/PythonProjects/gempy/gempy/core/solution.py:173: VisibleDeprecationWarning: Creating an ndarray from ragged nested sequences (which is a list-or-tuple of lists-or-tuples-or ndarrays with different lengths or shapes) is deprecated. If you meant to do this, you must specify 'dtype=object' when creating the ndarray.
self.geological_map = np.array(
/WorkSSD/PythonProjects/gempy/gempy/core/solution.py:178: VisibleDeprecationWarning: Creating an ndarray from ragged nested sequences (which is a list-or-tuple of lists-or-tuples-or ndarrays with different lengths or shapes) is deprecated. If you meant to do this, you must specify 'dtype=object' when creating the ndarray.
self.sections = np.array(
Lithology ids
[4. 4. 4. 4. 4. 4. 3. 3. 2. 2. 4. 4. 4. 4. 4. 4. 3. 3. 2. 2. 4. 4. 4. 4.
4. 4. 3. 3. 2. 2. 4. 4. 4. 4. 4. 4. 3. 3. 2. 2. 4. 4. 4. 4. 4. 4. 3. 3.
2. 2. 4. 4. 4. 4. 4. 4. 3. 3. 2. 2. 4. 4. 4. 4. 4. 4. 3. 3. 2. 2. 4. 4.
4. 4. 4. 4. 3. 3. 2. 2. 4. 4. 4. 4. 4. 4. 3. 3. 2. 2. 4. 4. 4. 4. 4. 4.
3. 3. 2. 2. 4. 4. 4. 4. 4. 4. 3. 3. 2. 2. 4. 4. 4. 4. 4. 4. 3. 3. 2. 2.
4. 4. 4. 4. 4. 4. 3. 3. 2. 2. 4. 4. 4. 4. 4. 4. 3. 3. 2. 2. 4. 4. 4. 4.
4. 4. 3. 3. 2. 2. 4. 4. 4. 4. 4. 4. 3. 3. 2. 2. 4. 4. 4. 4. 4. 4. 2. 2.
2. 2. 4. 4. 4. 4. 4. 4. 2. 2. 2. 2. 4. 4. 4. 4. 4. 4. 2. 2. 2. 2. 4. 4.
4. 4. 4. 4. 2. 2. 2. 2. 4. 4. 4. 4. 4. 4. 2. 2. 2. 2. 4. 4. 4. 4. 4. 4.
2. 2. 2. 2. 4. 4. 4. 4. 4. 4. 2. 2. 2. 2. 4. 4. 4. 4. 4. 4. 2. 2. 2. 2.
4. 4. 4. 4. 4. 4. 2. 2. 2. 2. 4. 4. 4. 4. 4. 4. 2. 2. 2. 2. 4. 4. 4. 4.
2. 2. 2. 2. 2. 2. 4. 4. 4. 4. 2. 2. 2. 2. 2. 2. 4. 4. 4. 4. 2. 2. 2. 2.
2. 2. 4. 4. 4. 4. 2. 2. 2. 2. 2. 2. 4. 4. 4. 4. 2. 2. 2. 2. 2. 2. 4. 4.
4. 4. 2. 2. 2. 2. 2. 2. 4. 4. 4. 4. 2. 2. 2. 2. 2. 2. 4. 4. 4. 4. 2. 2.
2. 2. 2. 2. 4. 4. 4. 4. 2. 2. 2. 2. 2. 2. 4. 4. 4. 4. 2. 2. 2. 2. 2. 2.
4. 4. 3. 3. 2. 2. 2. 2. 2. 2. 4. 4. 3. 3. 2. 2. 2. 2. 2. 2. 4. 4. 3. 3.
2. 2. 2. 2. 2. 2. 4. 4. 3. 3. 2. 2. 2. 2. 2. 2. 4. 4. 3. 3. 2. 2. 2. 2.
2. 2. 4. 4. 3. 3. 2. 2. 2. 2. 2. 2. 4. 4. 3. 3. 2. 2. 2. 2. 2. 2. 4. 4.
3. 3. 2. 2. 2. 2. 2. 2. 4. 4. 3. 3. 2. 2. 2. 2. 2. 2. 4. 4. 3. 3. 2. 2.
2. 2. 2. 2. 4. 4. 3. 3. 2. 2. 2. 2. 2. 2. 4. 4. 3. 3. 2. 2. 2. 2. 2. 2.
4. 4. 3. 3. 2. 2. 2. 2. 2. 2. 4. 4. 3. 3. 2. 2. 2. 2. 2. 2. 4. 4. 3. 3.
2. 2. 2. 2. 2. 2. 4. 4. 3. 3. 2. 2. 2. 2. 2. 2.]
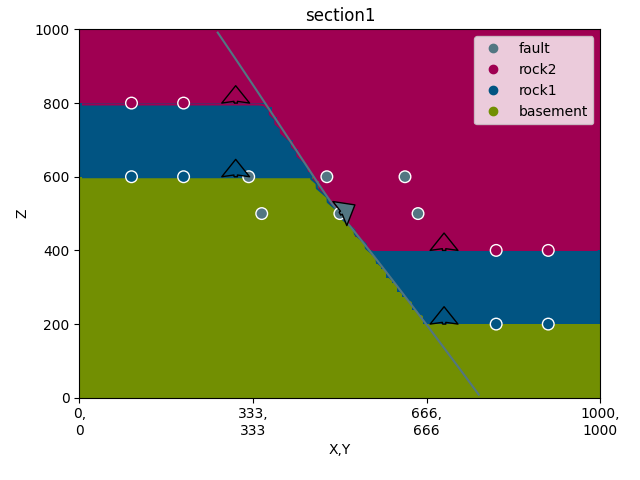
new plotting api
gp.plot_2d(geo_data, section_names=['section1'])
Out:
<gempy.plot.visualization_2d.Plot2D object at 0x7fcc748f31f0>
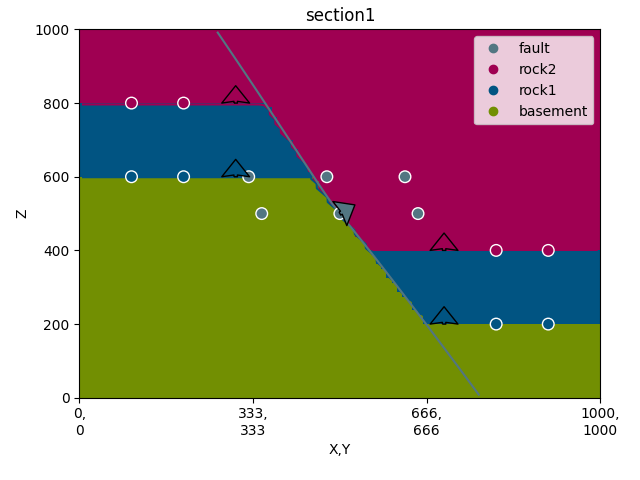
or
gp.plot.plot_2d(geo_data, section_names=['section1'])
Out:
<gempy.plot.visualization_2d.Plot2D object at 0x7fcc3a05f580>
Plot 2d: Object oriented:
One plot
p = gp.plot_2d(geo_data, section_names=[], direction=None, show=False)
p.fig.show()

p = gp.plot_2d(geo_data, section_names=[], direction=None, show=False)
# -----new code------

sec_name = 'section1'
s1 = p.add_section(sec_name)
p.plot_data(s1, sec_name, projection_distance=200)
p.fig.show()
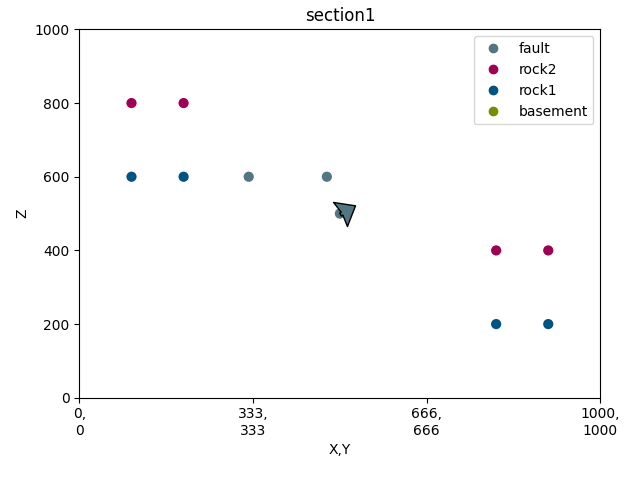
p = gp.plot_2d(geo_data, section_names=[], direction=None, show=False)
sec_name = 'section1'
s1 = p.add_section(sec_name)
# -----new code------

p.plot_data(s1, sec_name, projection_distance=200)
p.plot_contacts(s1, sec_name)
p.fig.show()
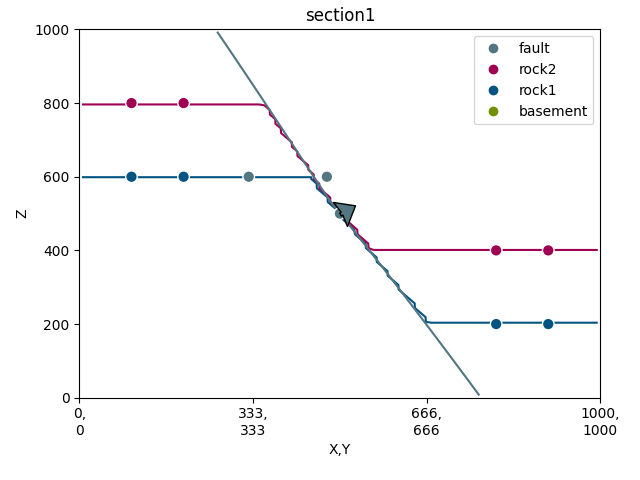
p = gp.plot_2d(geo_data, section_names=[], direction=None, show=False)
sec_name = 'section1'
s1 = p.add_section(sec_name)
p.plot_data(s1, sec_name, projection_distance=200)
p.plot_contacts(s1, sec_name)
# -----new code------

p.plot_lith(s1, sec_name)
p.plot_topography(s1, sec_name)
p.fig.show()
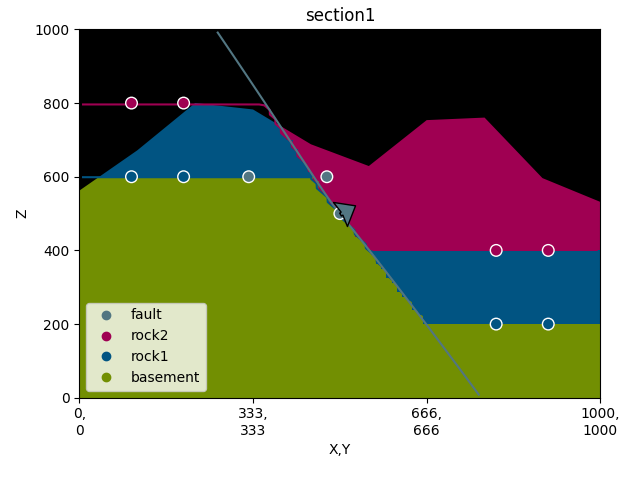
Several plots
sec_name = 'section1'
sec_name_2 = 'section3'

p2 = gp.plot_2d(geo_data, n_axis=3, figsize=(15, 15),  # General fig options
                section_names=[sec_name, 'topography'], cell_number=[3],  # Defining the sections
                show_data=False, show_lith=False, show_scalar=False, show_boundaries=False)
# Create the section. This loacte the axes and give the right
# aspect ratio and labels

p2 = gp.plot_2d(geo_data, n_axis=3, figsize=(15, 15),  # General fig options
                section_names=[sec_name, 'topography'], cell_number=[3],  # Defining the sections
                show_data=False, show_lith=False, show_scalar=False, show_boundaries=False,
                show=False)
# -----new code------

s1 = p2.add_section(sec_name_2, ax_pos=224)
p2.fig.show()
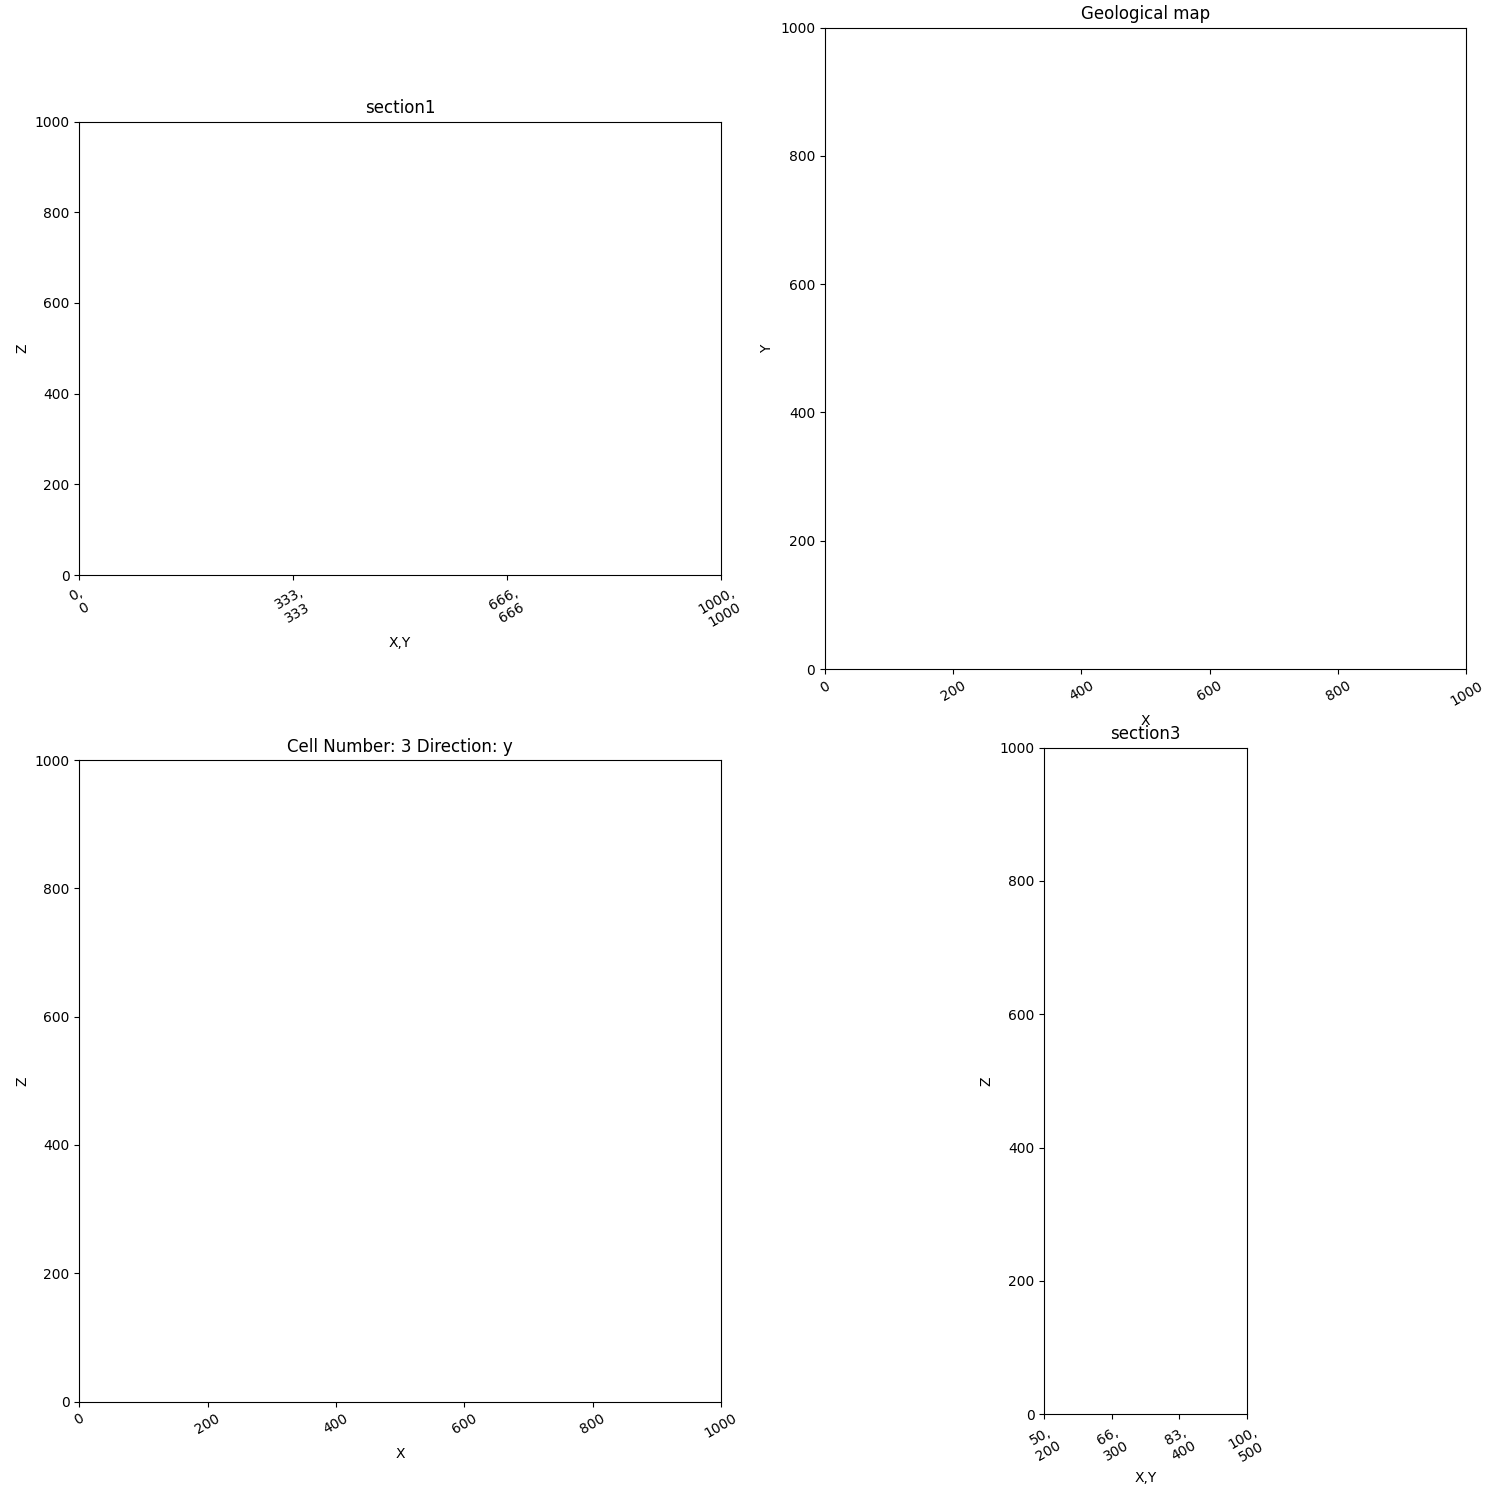
Axes 0
p2 = gp.plot_2d(geo_data, n_axis=3, figsize=(15, 15),  # General fig options
                section_names=[sec_name, 'topography'], cell_number=[3],  # Defining the sections
                show_data=False, show_lith=False, show_scalar=False, show_boundaries=False,
                show=False)
s1 = p2.add_section(sec_name_2, ax_pos=224)
# -----new code------

p2.plot_contacts(s1, sec_name_2)
p2.plot_lith(s1, sec_name_2)
p2.plot_data(s1, sec_name_2, projection_distance=200)
p2.plot_topography(s1, sec_name_2)
p2.fig.show()
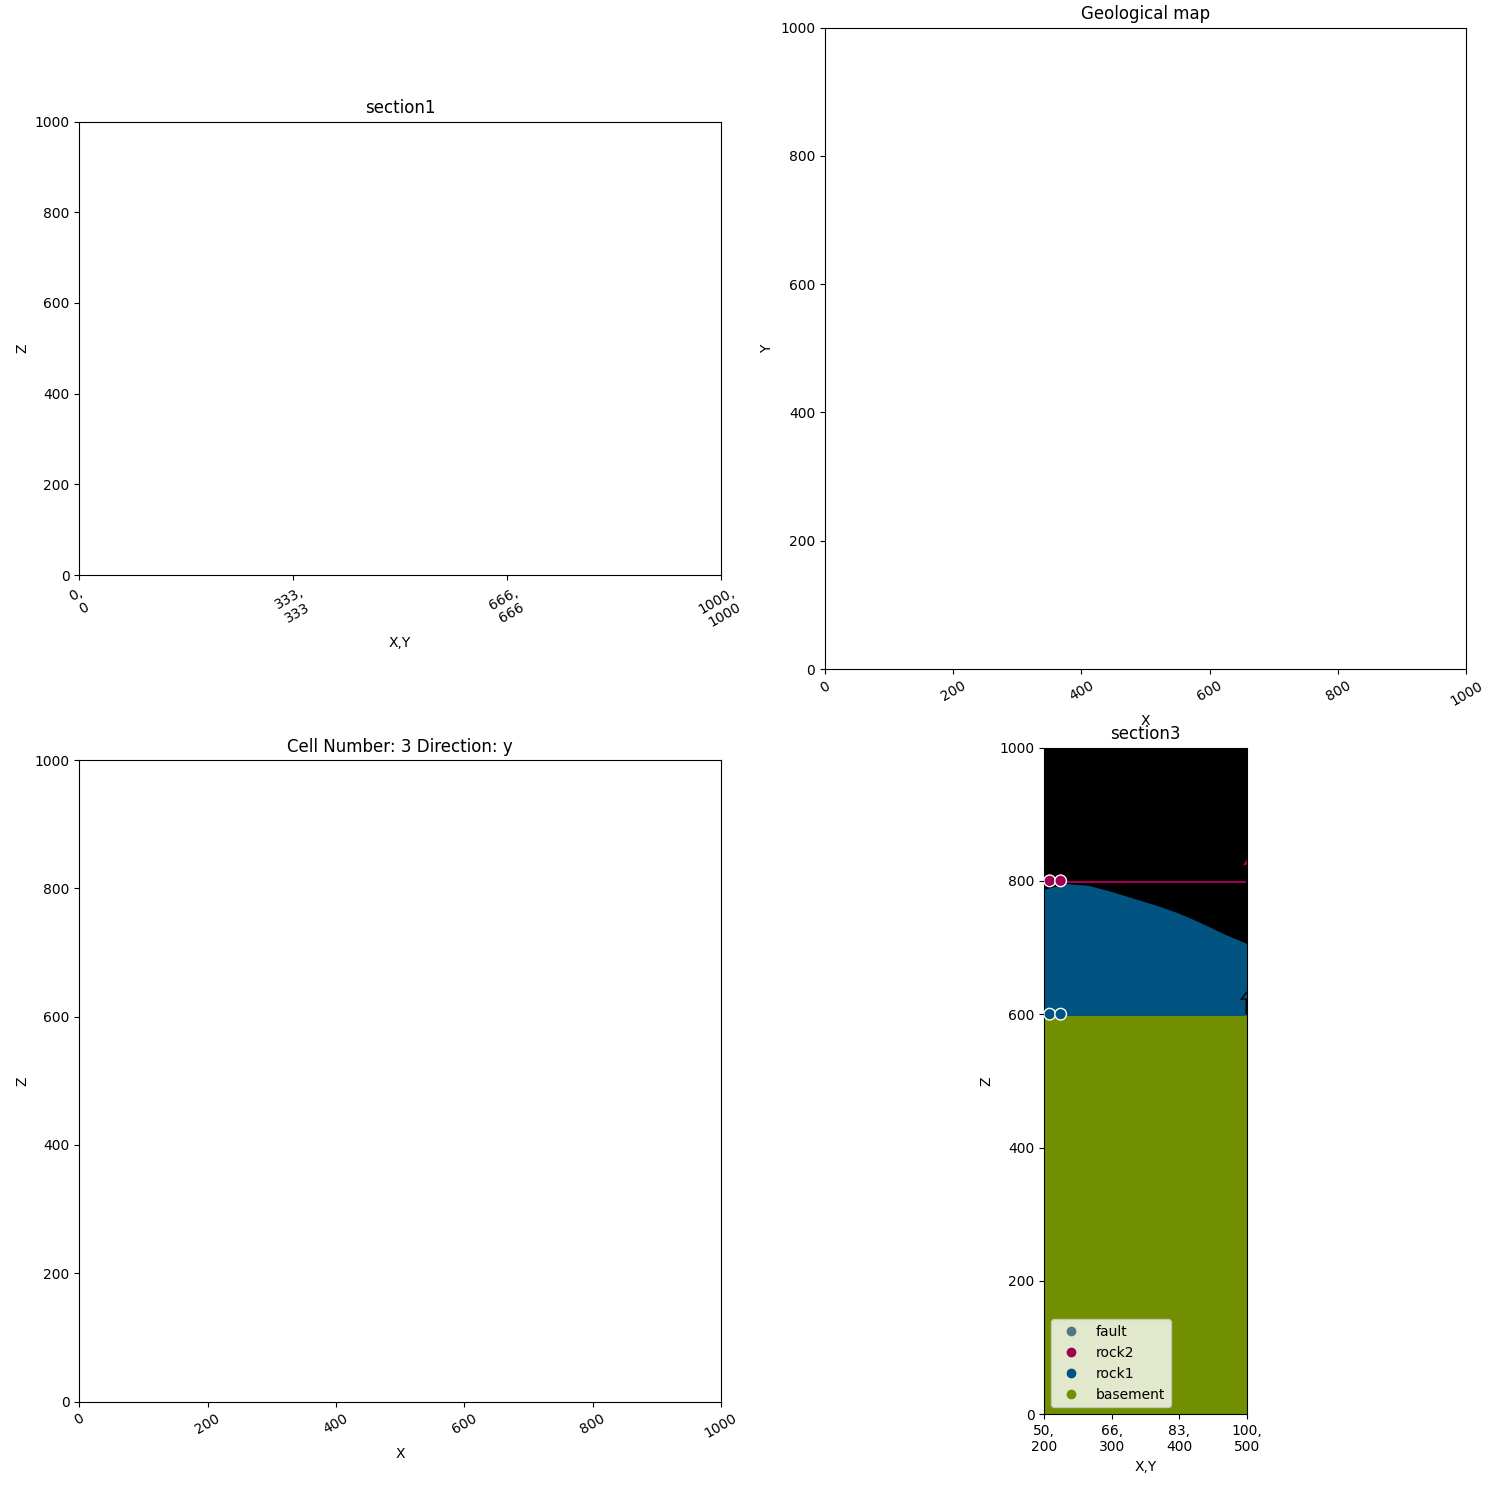
Axes 1
# sphinx_gallery_thumbnail_number = 12
p2 = gp.plot_2d(geo_data, n_axis=3, figsize=(15, 15),  # General fig options
                section_names=[sec_name, 'topography'], cell_number=[3],  # Defining the sections
                show_data=False, show_lith=False, show_scalar=False, show_boundaries=False,
                show=False)
s1 = p2.add_section(sec_name_2, ax_pos=224)
p2.plot_contacts(s1, sec_name_2)
p2.plot_lith(s1, sec_name_2)
p2.plot_data(s1, sec_name_2, projection_distance=200)
p2.plot_topography(s1, sec_name_2)
# -----new code------

p2.plot_contacts(p2.axes[0], cell_number=3)
p2.plot_scalar_field(p2.axes[0], cell_number=3, series_n=1)
p2.fig.show()
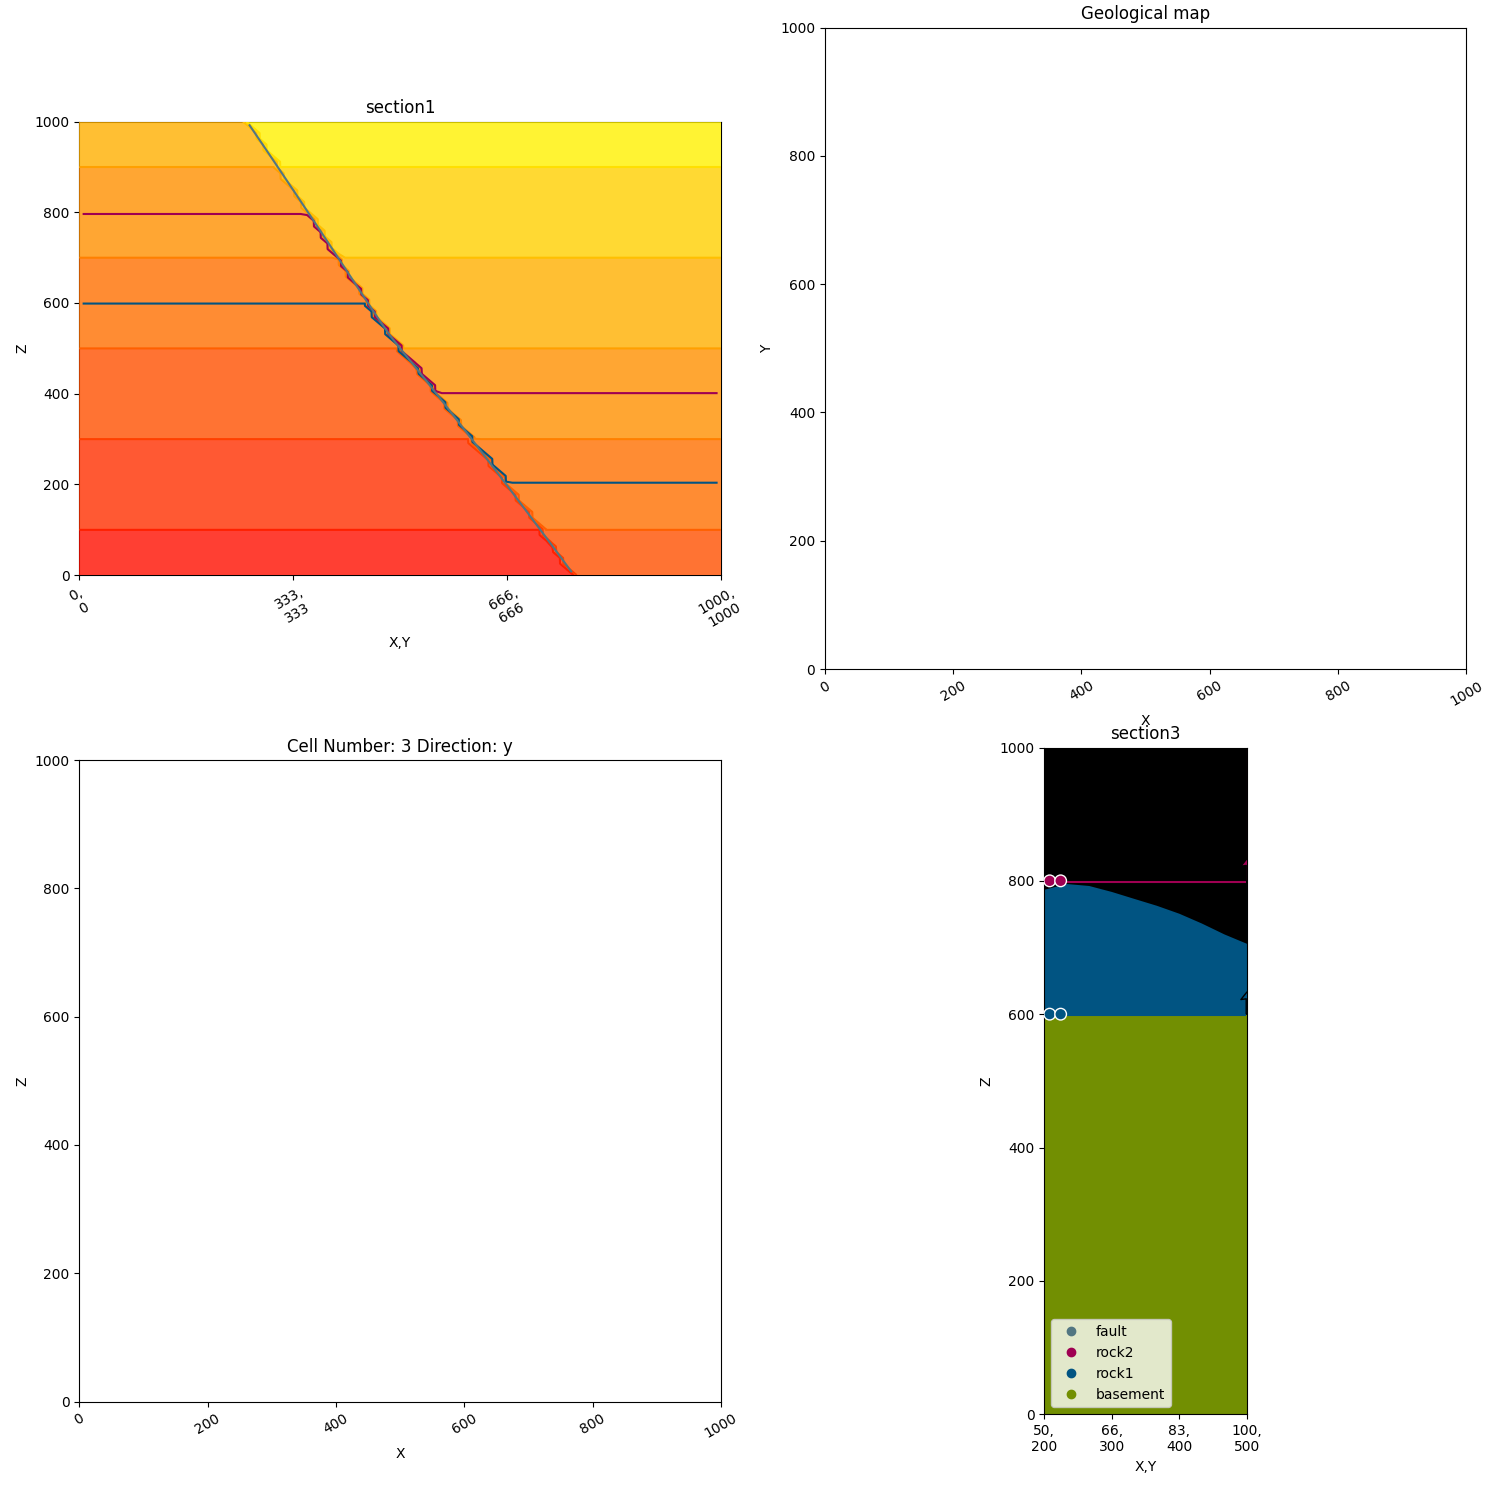
Axes2
p2 = gp.plot_2d(geo_data, n_axis=3, figsize=(15, 15),  # General fig options
                section_names=[sec_name, 'topography'], cell_number=[3],  # Defining the sections
                show_data=False, show_lith=False, show_scalar=False, show_boundaries=False,
                show=False)
s1 = p2.add_section(sec_name_2, ax_pos=224)
p2.plot_contacts(s1, sec_name_2)
p2.plot_lith(s1, sec_name_2)
p2.plot_data(s1, sec_name_2, projection_distance=200)
p2.plot_topography(s1, sec_name_2)
p2.plot_contacts(p2.axes[0], cell_number=3)
p2.plot_scalar_field(p2.axes[0], cell_number=3, series_n=1)
# -----new code------

p2.plot_lith(p2.axes[1], 'topography')
p2.plot_contacts(p2.axes[1], 'topography')
p2.fig.show()
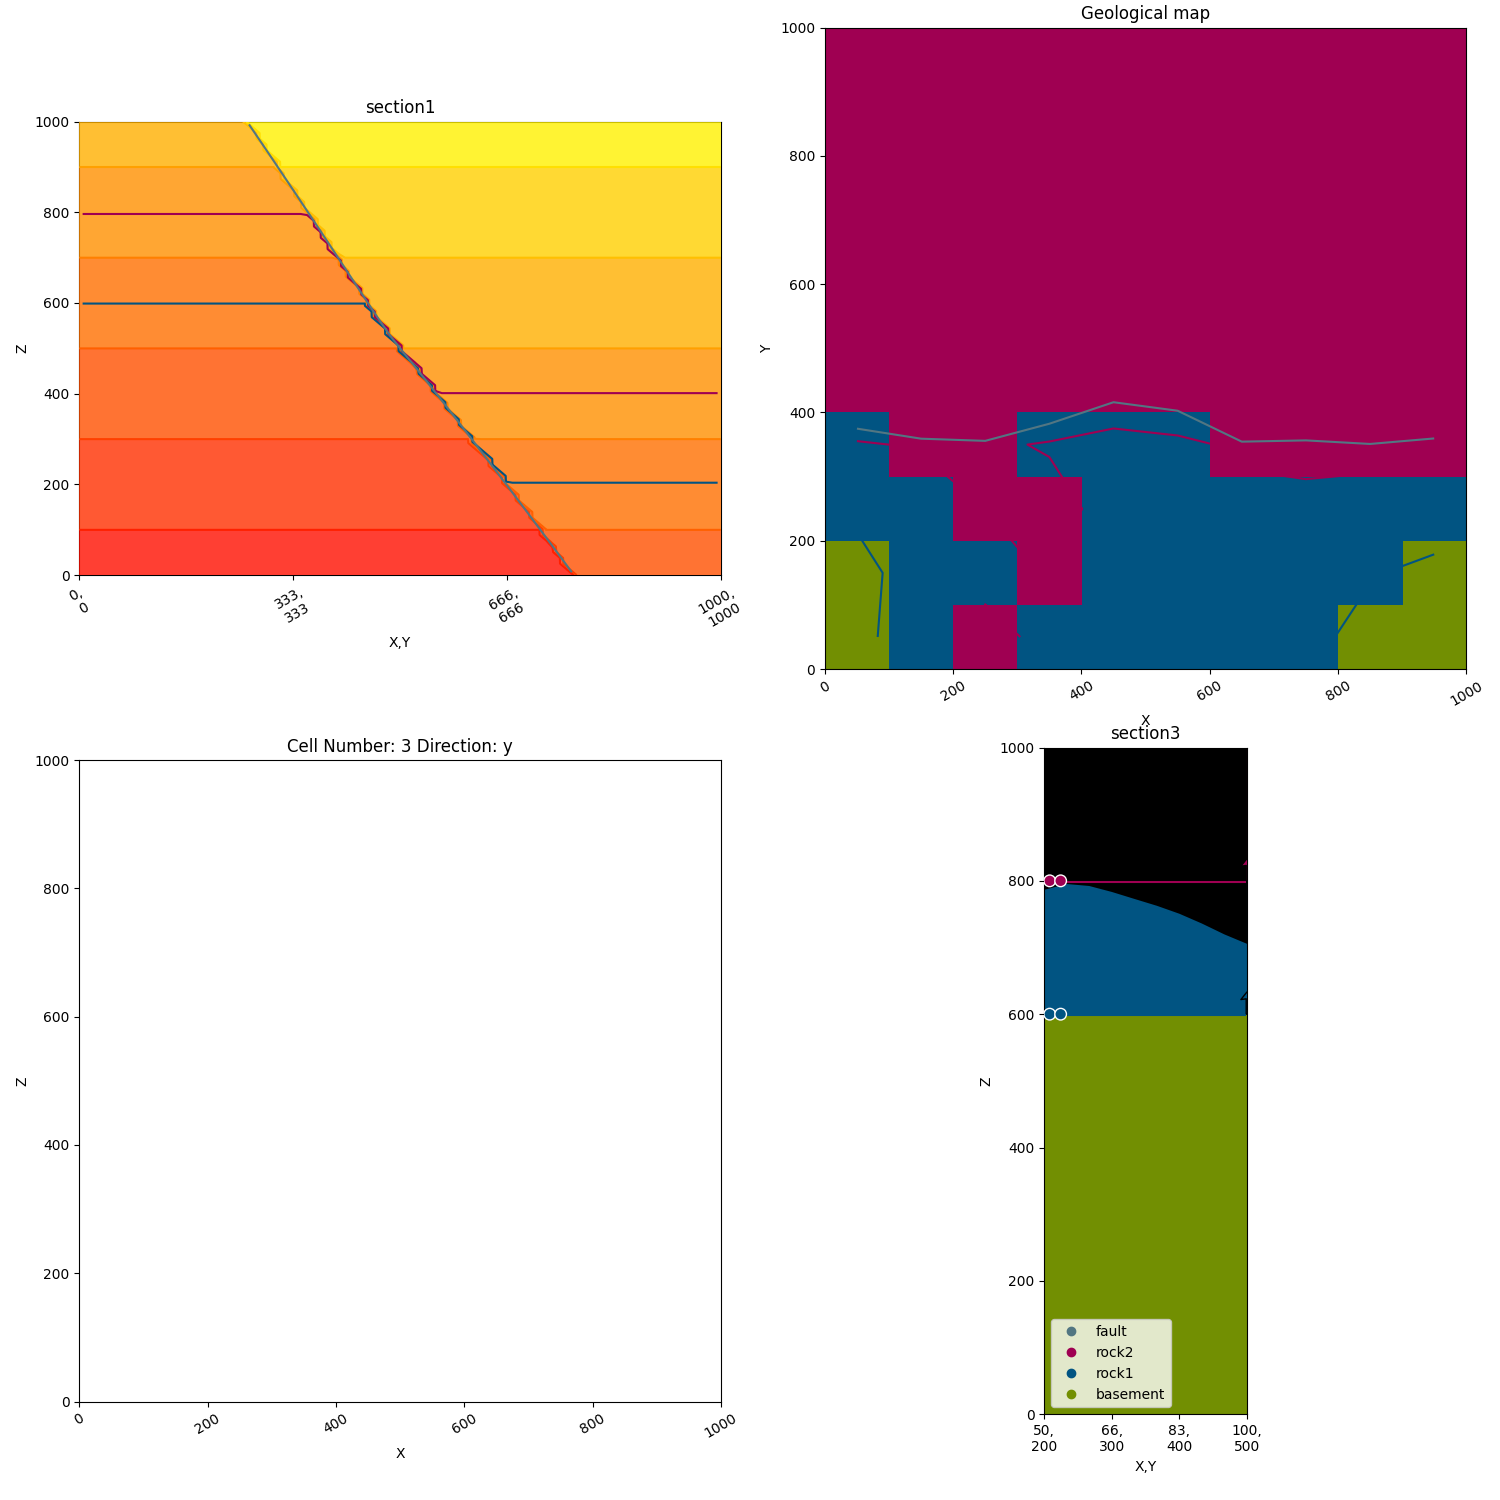
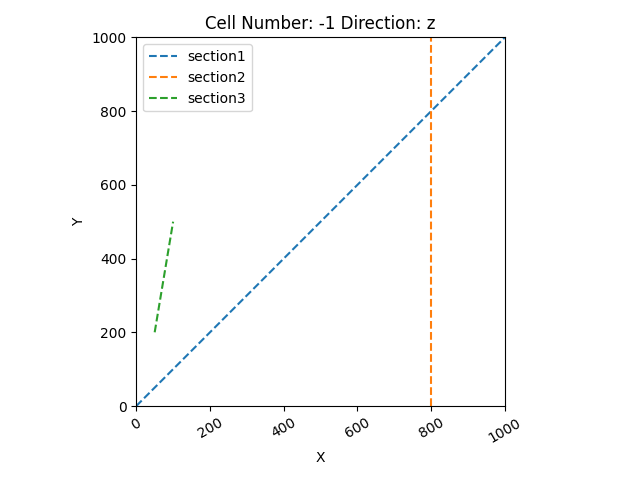
Plotting traces:
p2.plot_section_traces(p2.axes[1])
p2.fig.show()
gp.plot.plot_section_traces(geo_data)
Out:
<gempy.plot.visualization_2d.Plot2D object at 0x7fcb84d3afd0>
Plot API
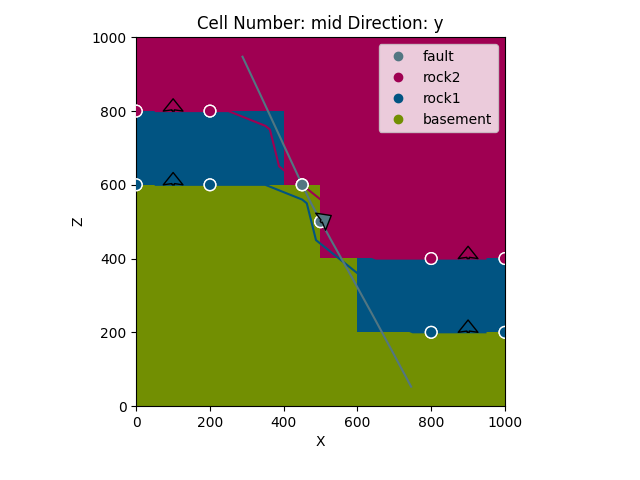
If nothing is passed, a Plot2D object is created and therefore you are in the same situation as above:
p3 = gp.plot_2d(geo_data)
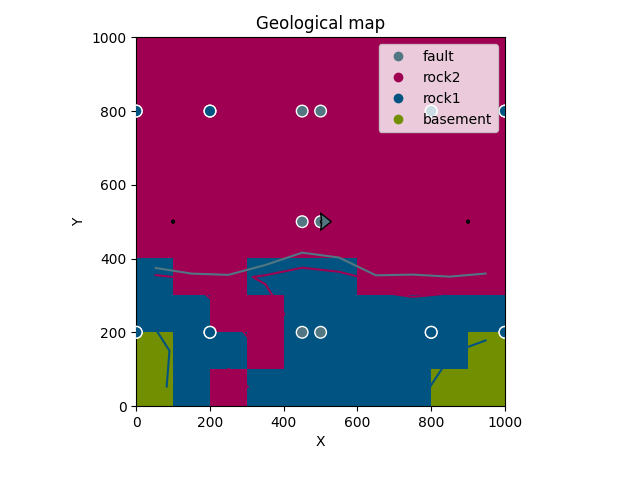
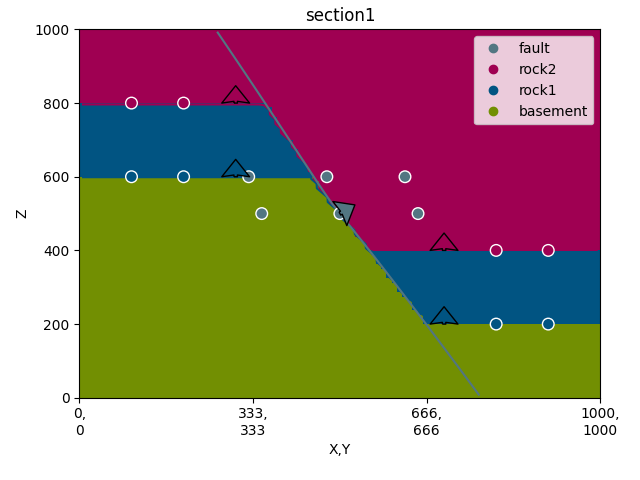
Alternatively you can pass section_names, cell_numbers + direction or any combination of the above:
gp.plot_2d(geo_data, section_names=['topography'])
Out:
<gempy.plot.visualization_2d.Plot2D object at 0x7fcc46ba6910>
gp.plot_2d(geo_data, section_names=['section1'])
Out:
<gempy.plot.visualization_2d.Plot2D object at 0x7fcbe00cda90>
gp.plot_2d(geo_data, section_names=['section1', 'section2'])
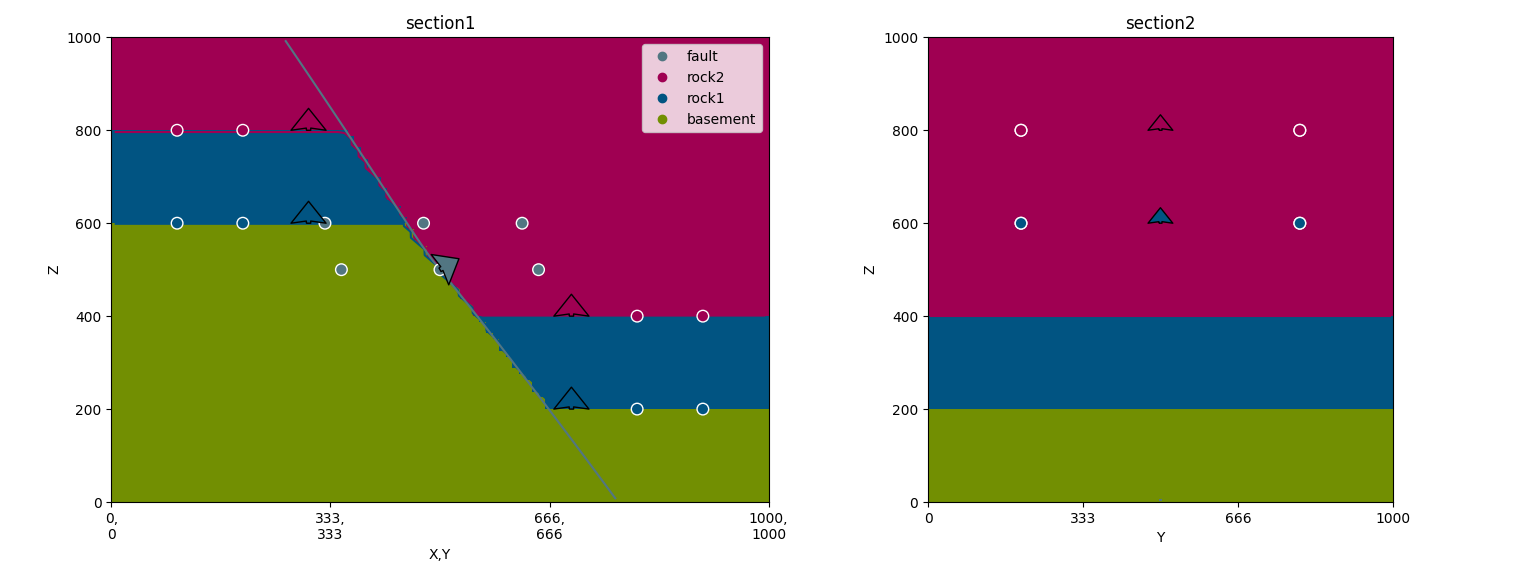
Out:
<gempy.plot.visualization_2d.Plot2D object at 0x7fcc46b47400>
gp.plot_2d(geo_data, figsize=(15, 15), section_names=['section1', 'section2', 'topography'],
           cell_number='mid')
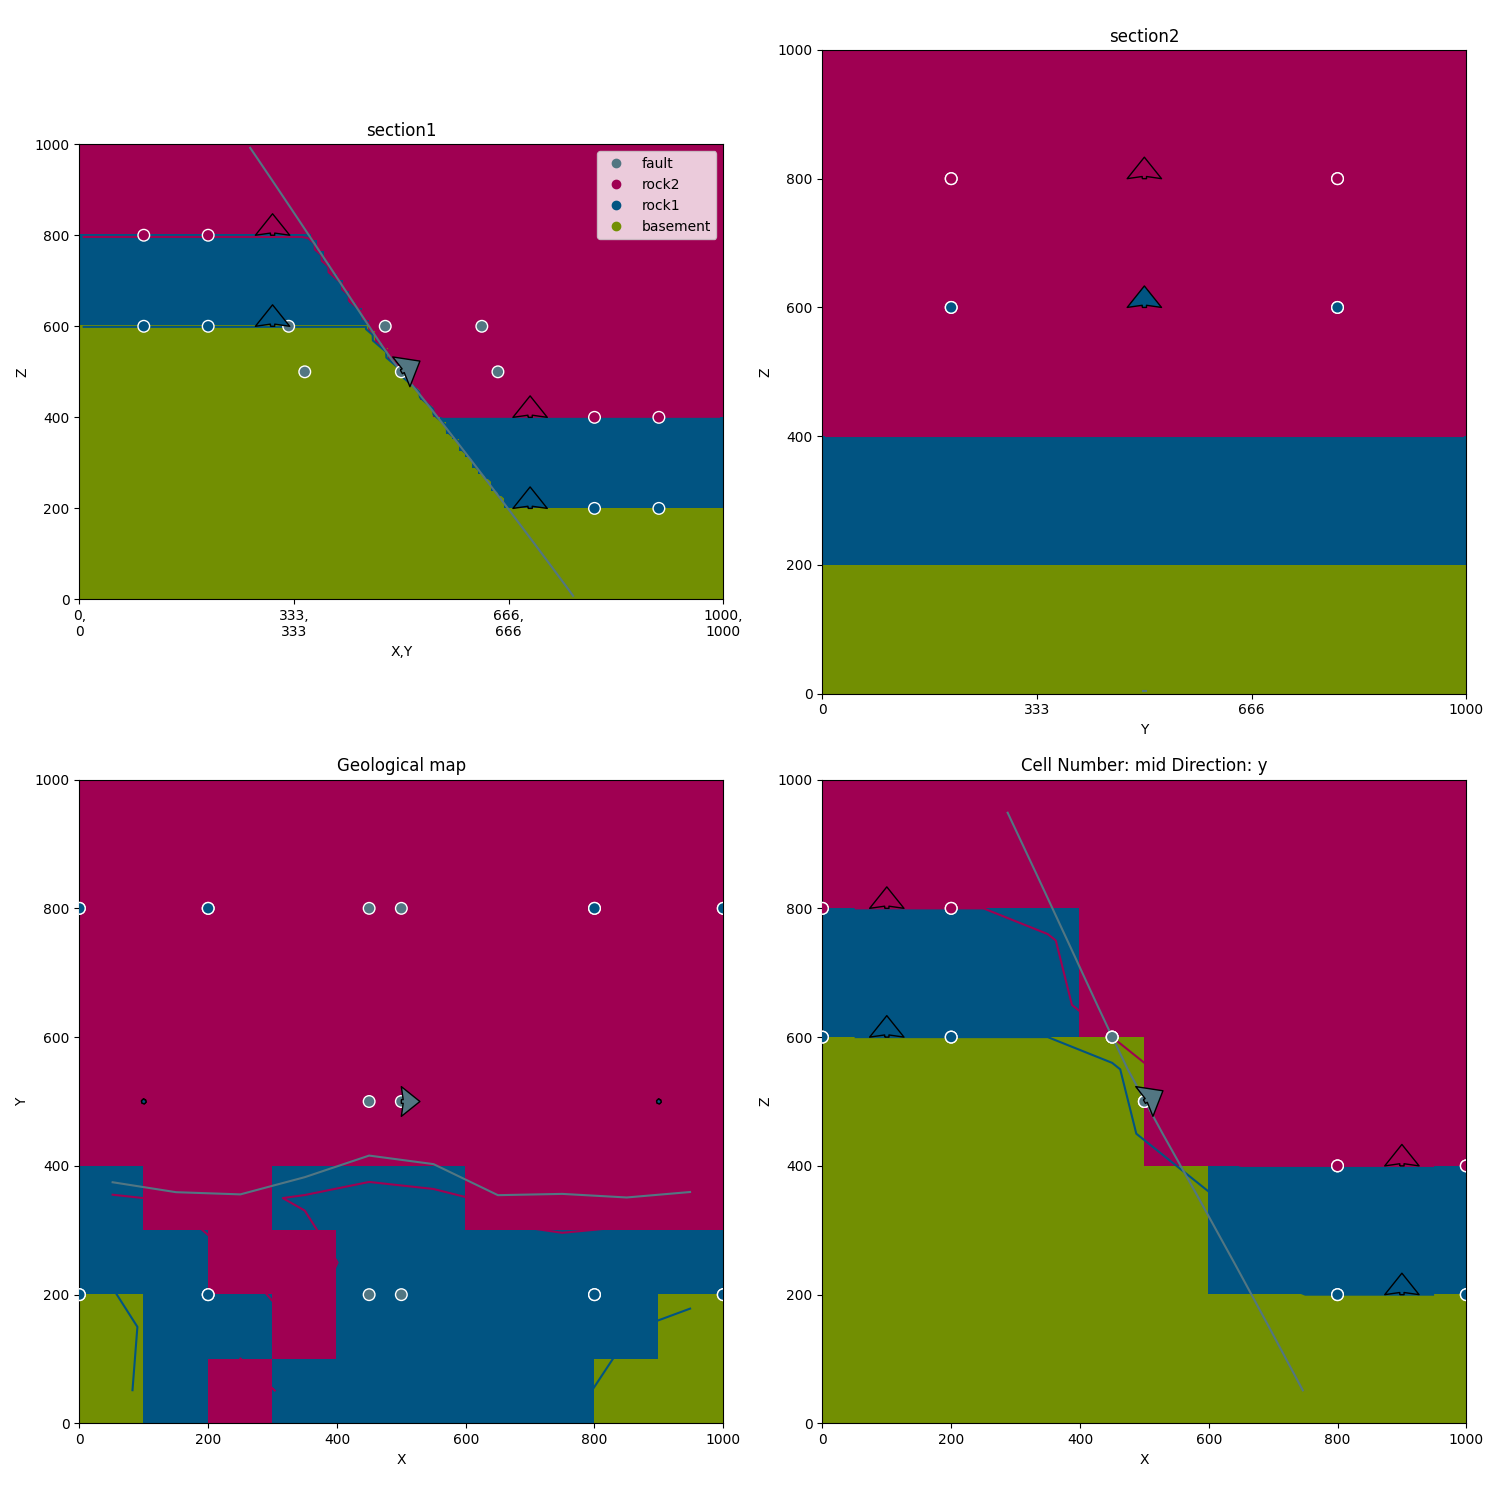
Out:
<gempy.plot.visualization_2d.Plot2D object at 0x7fcc74762df0>
Total running time of the script: ( 0 minutes 9.016 seconds)
