Note
Click here to download the full example code
1.7: 3-D Visualization
Importing GemPy
import gempy as gp

# Importing auxiliary libraries
import numpy as np
import matplotlib.pyplot as plt
Loading an example geomodel
data_path = 'https://raw.githubusercontent.com/cgre-aachen/gempy_data/master/'

geo_model = gp.create_data('viz_3d',
                           [0, 2000, 0, 2000, 0, 1600],
                           [50, 50, 50],
                           path_o=data_path + "data/input_data/lisa_models/foliations" + str(
                               7) + ".csv",
                           path_i=data_path + "data/input_data/lisa_models/interfaces" + str(
                               7) + ".csv"
                           )

gp.map_stack_to_surfaces(
    geo_model,
    {"Fault_1": 'Fault_1', "Fault_2": 'Fault_2',
     "Strat_Series": ('Sandstone', 'Siltstone', 'Shale', 'Sandstone_2', 'Schist', 'Gneiss')}
)

geo_model.set_is_fault(['Fault_1', 'Fault_2'])
geo_model.set_topography()

gp.set_interpolator(geo_model)
gp.compute_model(geo_model, compute_mesh=True)
Out:
Active grids: ['regular']
/home/miguel/miniconda3/envs/gempy/lib/python3.8/site-packages/pandas/core/arraylike.py:358: RuntimeWarning: invalid value encountered in arccos
  result = getattr(ufunc, method)(*inputs, **kwargs)
/WorkSSD/PythonProjects/gempy/gempy/core/data_modules/geometric_data.py:537: UserWarning: If pole_vector and orientation are passed pole_vector is used/
  warnings.warn('If pole_vector and orientation are passed pole_vector is used/')
Fault colors changed. If you do not like this behavior, set change_color to False.
[1280. 1600.]
Active grids: ['regular' 'topography']
Setting kriging parameters to their default values.
Compiling theano function...
Level of Optimization:  fast_compile
Device:  cpu
Precision:  float64
Number of faults:  2
Compilation Done!
Kriging values:
                        values
range                 3249.62
$C_o$               251428.57
drift equations  [3, 3, 3, 3]
/WorkSSD/PythonProjects/gempy/gempy/core/solution.py:173: VisibleDeprecationWarning: Creating an ndarray from ragged nested sequences (which is a list-or-tuple of lists-or-tuples-or ndarrays with different lengths or shapes) is deprecated. If you meant to do this, you must specify 'dtype=object' when creating the ndarray.
  self.geological_map = np.array(


Lithology ids
  [9. 9. 9. ... 3. 3. 3.]
Basic plotting API
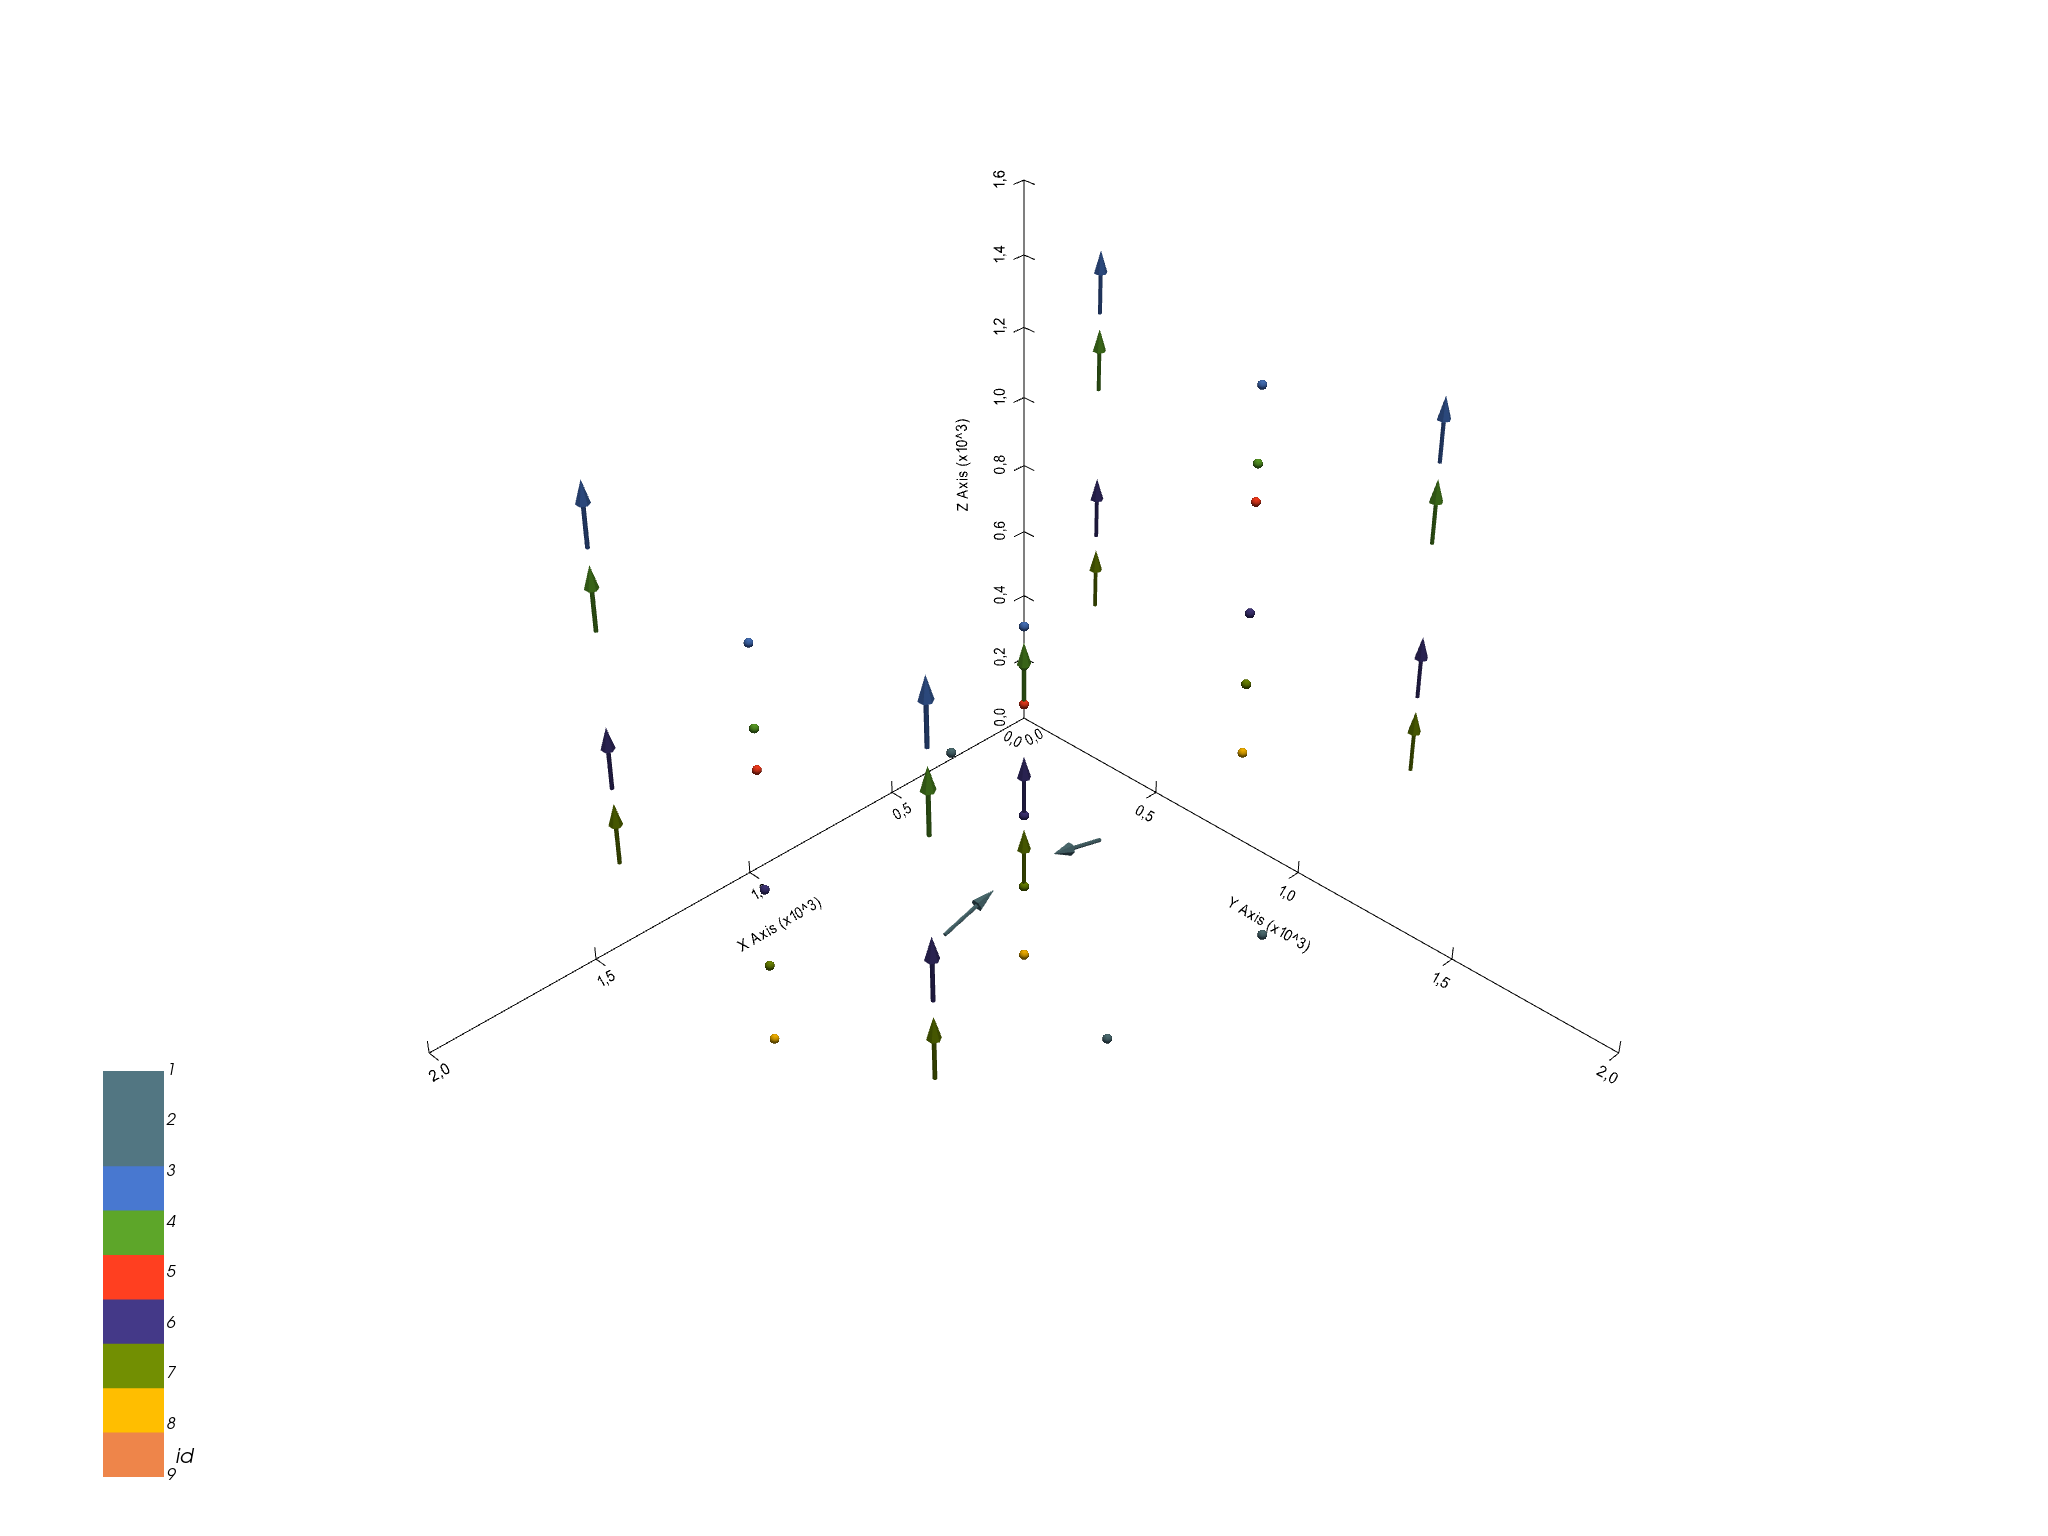
Data plot
gp.plot_3d(geo_model, show_surfaces=False, show_data=True, show_lith=False, image=False)

Out:
<gempy.plot.vista.GemPyToVista object at 0x7fcb8bad0850>
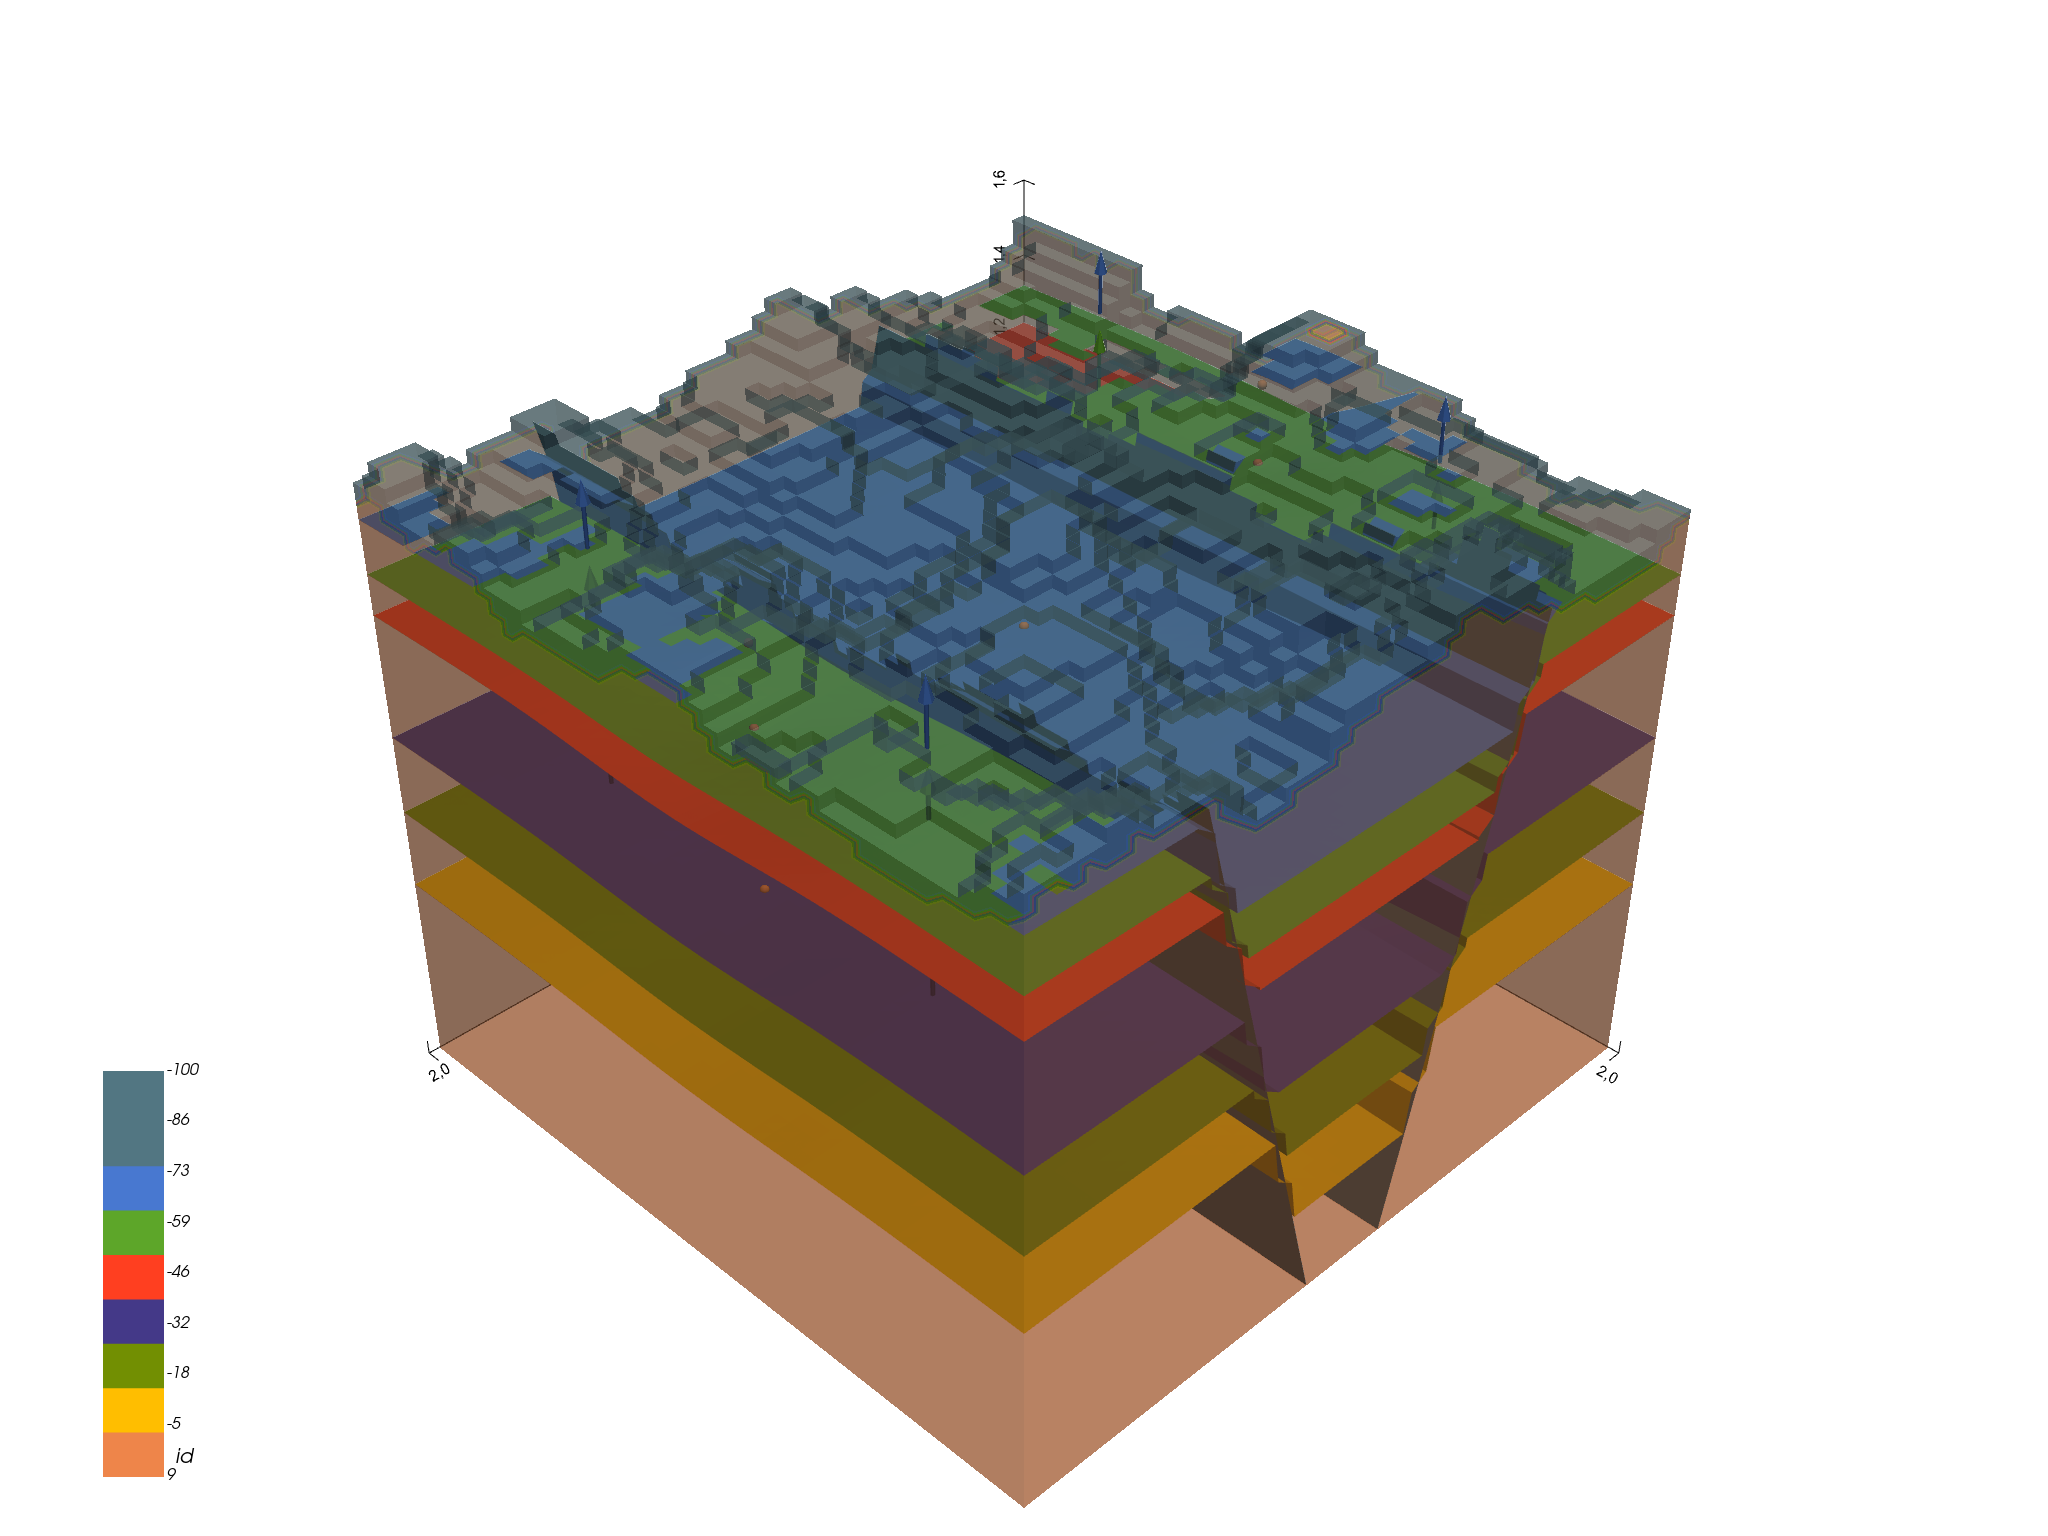
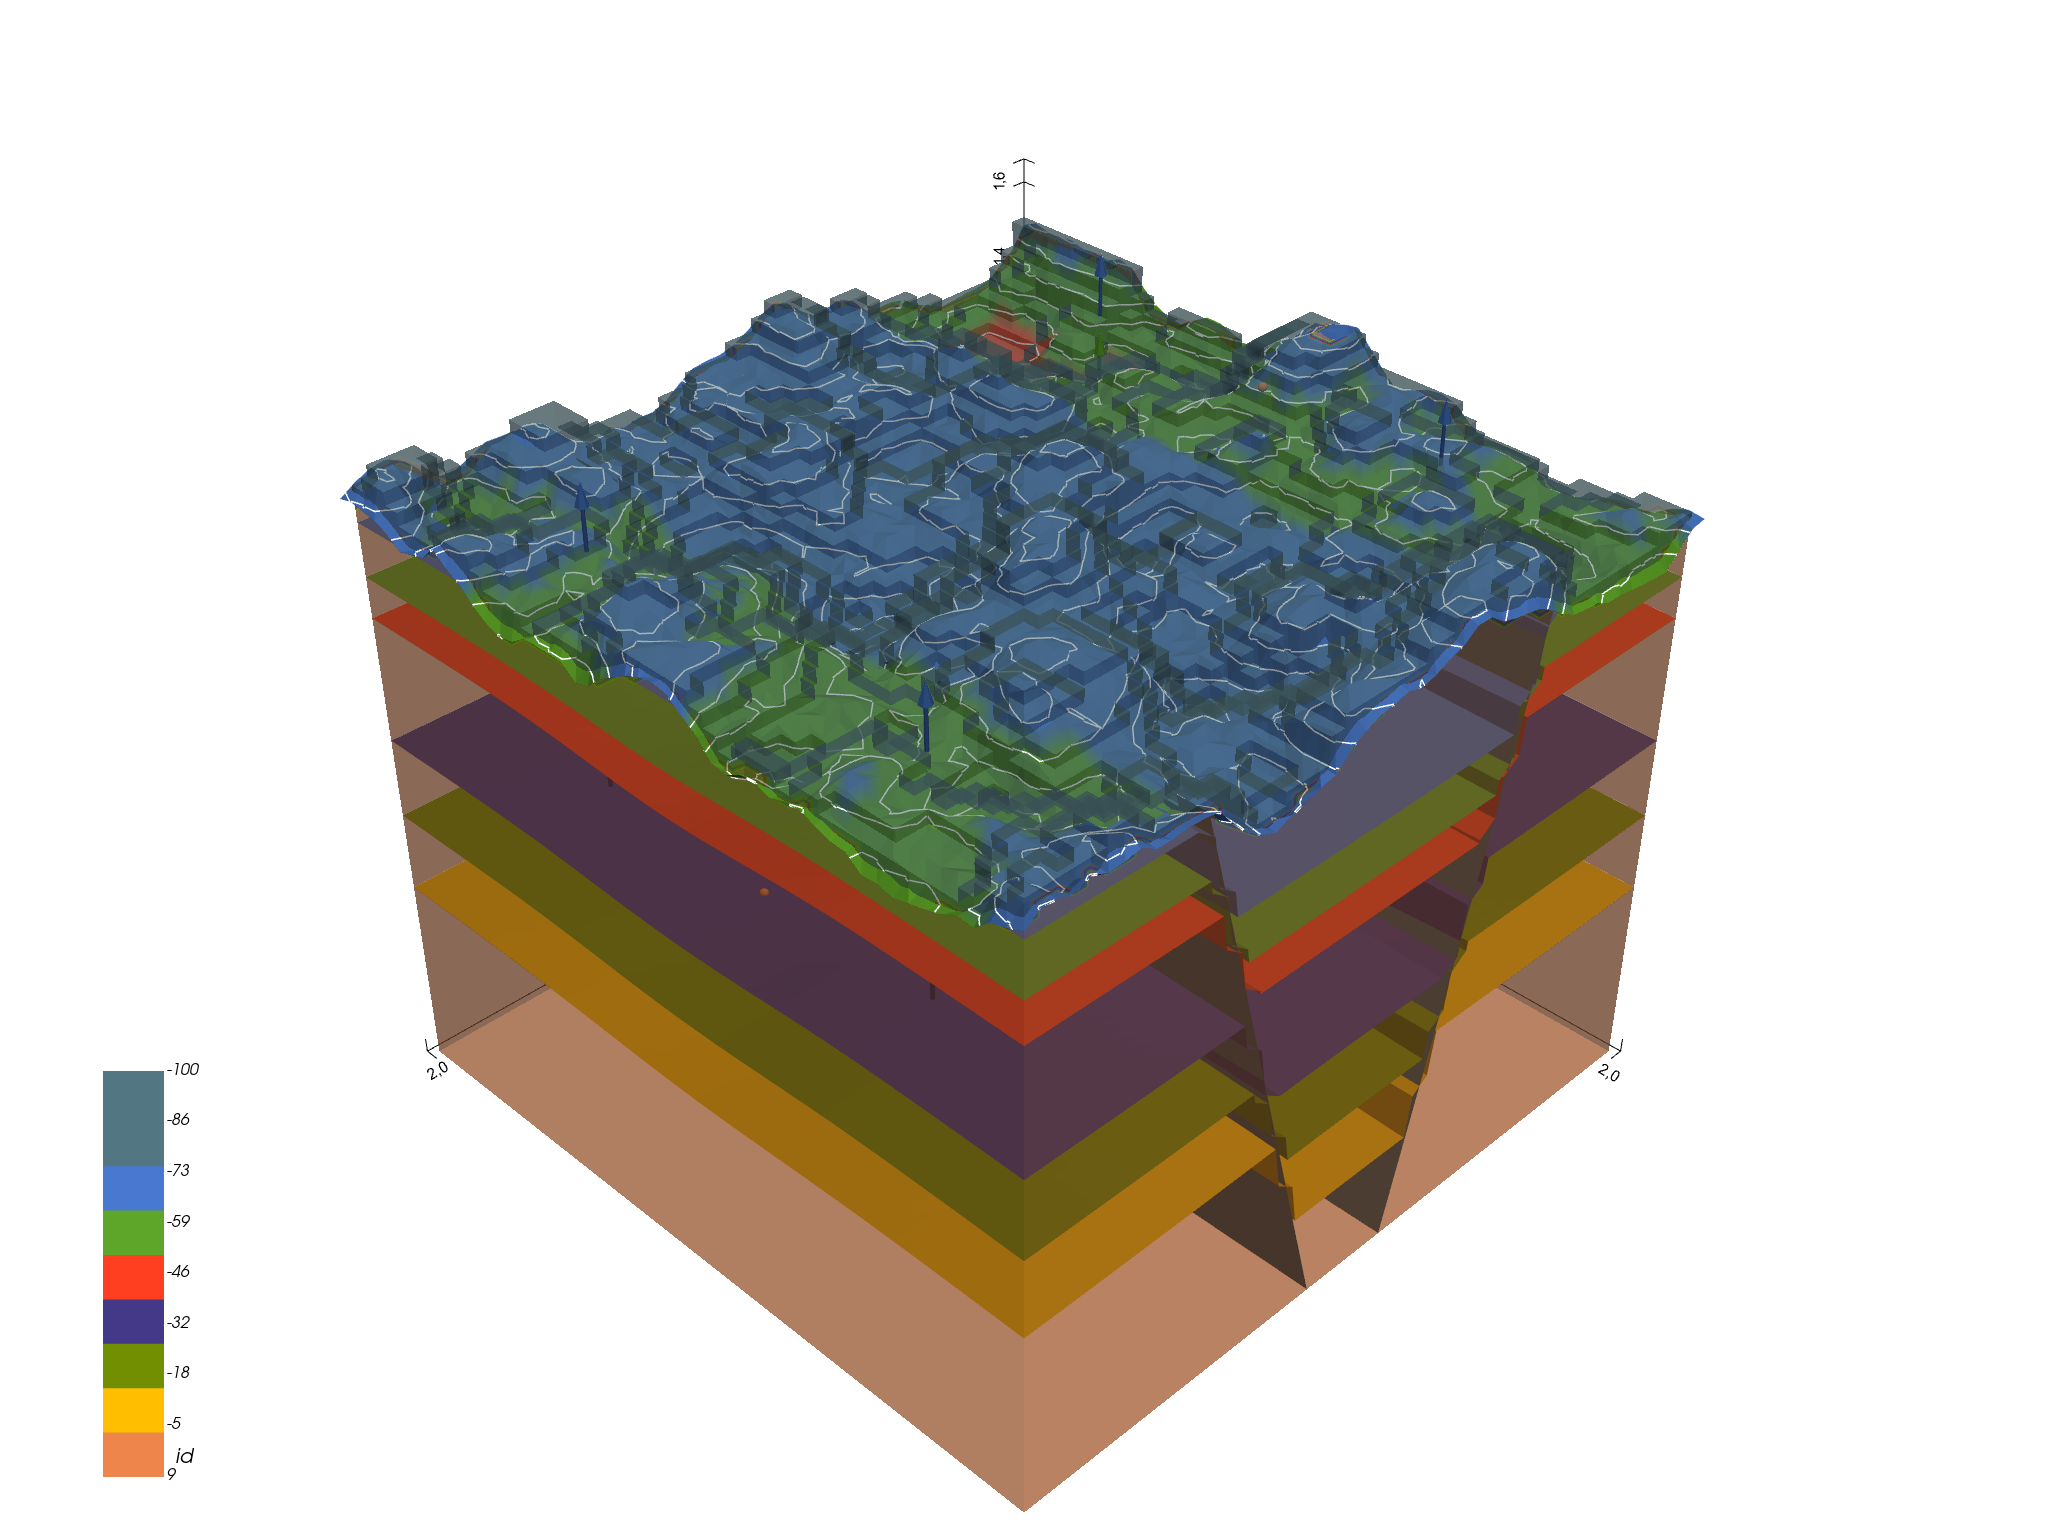
Geomodel plot
gp.plot_3d(geo_model, image=False)

Out:
<gempy.plot.vista.GemPyToVista object at 0x7fcc6b916430>

Out:
True
Total running time of the script: ( 0 minutes 7.775 seconds)
