Note
Click here to download the full example code
2.1 Forward Gravity: Simple example
Importing gempy
import gempy as gp
from gempy.assets.geophysics import GravityPreprocessing

# Aux imports
import numpy as np
import pandas as pd
import os
import matplotlib.pyplot as plt

np.random.seed(1515)
pd.set_option('precision', 2)
Out:
Active grids: ['regular']

Out:
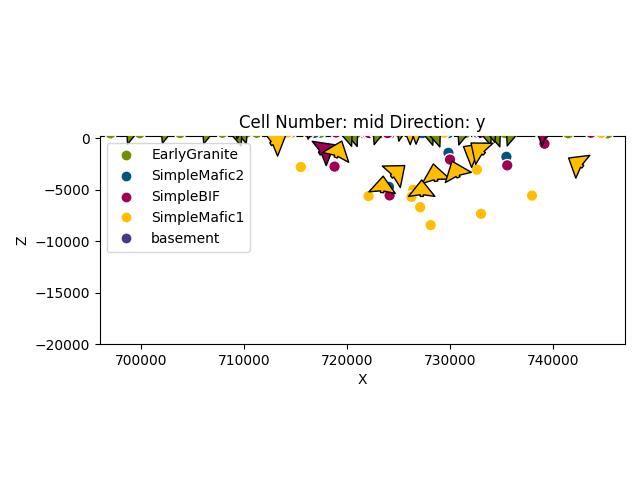
<gempy.plot.visualization_2d.Plot2D object at 0x7fcc4670beb0>
Creating grid
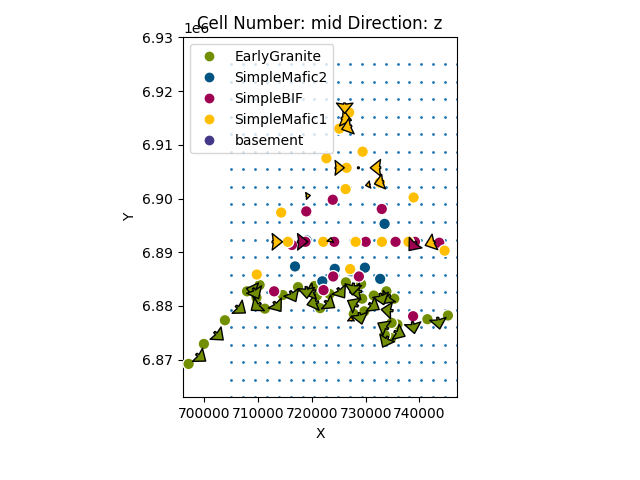
First we need to define the location of the devices. For this example we can make a map:
Out:
array([[7.05000000e+05, 6.86300000e+06, 3.00000000e+02],
       [7.07210526e+05, 6.86300000e+06, 3.00000000e+02],
       [7.09421053e+05, 6.86300000e+06, 3.00000000e+02],
       ...,
       [7.42578947e+05, 6.92500000e+06, 3.00000000e+02],
       [7.44789474e+05, 6.92500000e+06, 3.00000000e+02],
       [7.47000000e+05, 6.92500000e+06, 3.00000000e+02]])
We can see the location of the devices relative to the model data:
gp.plot_2d(geo_model, direction='z', show=False)
plt.scatter(xy_ravel[:, 0], xy_ravel[:, 1], s=1)
plt.show()

Now we need to create the grid centered on the devices (see: https://github.com/cgre-aachen/gempy/blob/master/notebooks/tutorials/ch1-3-Grids.ipynb)
geo_model.set_centered_grid(xy_ravel, resolution=[10, 10, 15], radius=5000)
Out:
Active grids: ['regular' 'centered']

Grid Object. Values:
array([[ 6.96510000e+05,  6.86367000e+06, -1.97980000e+04],
       [ 6.96510000e+05,  6.86367000e+06, -1.93940000e+04],
       [ 6.96510000e+05,  6.86367000e+06, -1.89900000e+04],
       ...,
       [ 7.52000000e+05,  6.93000000e+06, -3.10768481e+03],
       [ 7.52000000e+05,  6.93000000e+06, -4.31811404e+03],
       [ 7.52000000e+05,  6.93000000e+06, -6.00000000e+03]])
Out:
array([[-5000.        , -5000.        ,  -300.        ],
       [-5000.        , -5000.        ,  -360.        ],
       [-5000.        , -5000.        ,  -383.36972966],
       ...,
       [ 5000.        ,  5000.        , -3407.68480754],
       [ 5000.        ,  5000.        , -4618.11403801],
       [ 5000.        ,  5000.        , -6300.        ]])
Now we need to compute the component tz (see https://github.com/cgre-achen/gempy/blob/master/notebooks/tutorials/ch2-2-Cell_selection.ipynb)
tz = g.set_tz_kernel()
Out:
array([-0.00435884, -0.0035374 , -0.00260207, ..., -0.60455378,
       -0.888396  , -0.98280245])
Compiling the gravity graph
If geo_model has already a centered grid, the calculation of tz happens automatically. This theano graph will return gravity as well as the lithologies. In addition we need either to pass the density block (see below). Or the position of density on the surface(in the future the name) to compute the density block at running time.
In this case the densities of each layer are at the loc 1 (0 is the id)
# New way
gp.set_interpolator(geo_model, output=['gravity'], pos_density=1, gradient=False,
                    theano_optimizer='fast_run')
Out:
Setting kriging parameters to their default values.
Compiling theano function...
Level of Optimization:  fast_run
Device:  cpu
Precision:  float64
Number of faults:  0
Compilation Done!
Kriging values:
                        values
range                86591.22
$C_o$             178524761.9
drift equations  [3, 3, 3, 3]
nugget grad              0.01
nugget scalar             0.0

<gempy.core.interpolator.InterpolatorModel object at 0x7fcc46f045e0>
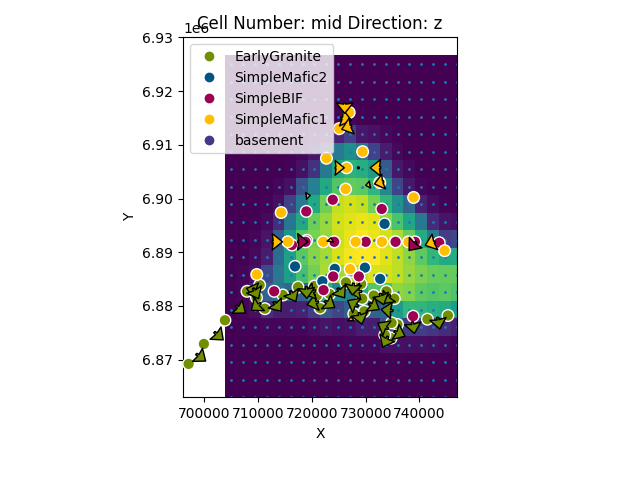
Once we have created a gravity interpolator we can call it from compute model as follows:
gp.plot_2d(geo_model, direction=['z'], height=7, show_results=False, show_data=True,
           show=False)
plt.scatter(xy_ravel[:, 0], xy_ravel[:, 1], s=1)
plt.imshow(sol.fw_gravity.reshape(grav_res, grav_res),
           extent=(xy_ravel[:, 0].min() + (xy_ravel[0, 0] - xy_ravel[1, 0]) / 2,
                   xy_ravel[:, 0].max() - (xy_ravel[0, 0] - xy_ravel[1, 0]) / 2,
                   xy_ravel[:, 1].min() + (xy_ravel[0, 1] - xy_ravel[30, 1]) / 2,
                   xy_ravel[:, 1].max() - (xy_ravel[0, 1] - xy_ravel[30, 1]) / 2),
           cmap='viridis_r', origin='lower')
plt.show()

Plotting lithologies
If we want to compute the lithologies we will need to create a normal interpolator object as seen in the Chapter 1 of the tutorials
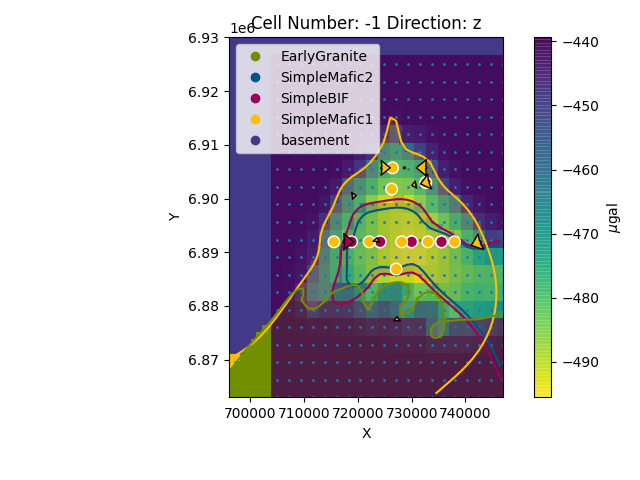
Now we can plot all together (change the alpha parameter to see the gravity overlying):
sphinx_gallery_thumbnail_number = 4
gp.plot_2d(geo_model, cell_number=[-1], direction=['z'], show=False,
           kwargs_regular_grid={'alpha': .5})

plt.scatter(xy_ravel[:, 0], xy_ravel[:, 1], s=1)
plt.imshow(grav.reshape(grav_res, grav_res),
           extent=(xy_ravel[:, 0].min() + (xy_ravel[0, 0] - xy_ravel[1, 0]) / 2,
                   xy_ravel[:, 0].max() - (xy_ravel[0, 0] - xy_ravel[1, 0]) / 2,
                   xy_ravel[:, 1].min() + (xy_ravel[0, 1] - xy_ravel[30, 1]) / 2,
                   xy_ravel[:, 1].max() - (xy_ravel[0, 1] - xy_ravel[30, 1]) / 2),
           cmap='viridis_r', origin='lower', alpha=.8)
cbar = plt.colorbar()
cbar.set_label(r'$\mu$gal')
plt.show()

Total running time of the script: ( 0 minutes 39.185 seconds)
