Note
Go to the end to download the full example code
Visual Scripting compiled model
Executing: Normal

Executing: Sample

Executing: Gamma

Executing: Sample

Executing: Normal

Executing: Sample

Executing: PyroModel

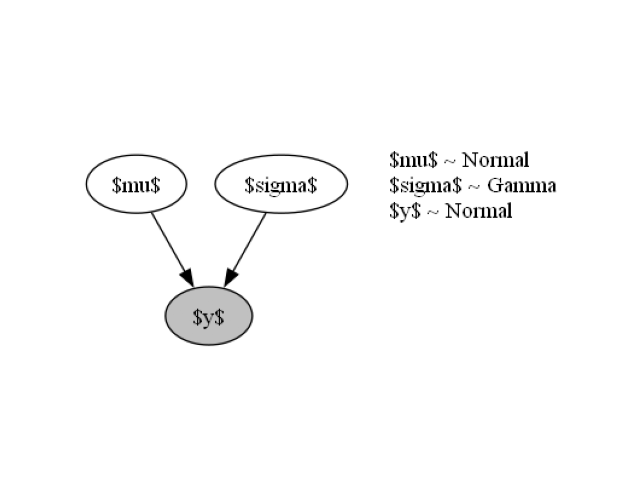
Executing: VisualizeModelGraph

Executing: PriorPredictive

Executing: NUTS

Executing: MCMC

Executing: RunMCMC

Warmup:   0%|                                                        | 0/100 [00:00, ?it/s]
Warmup:  31%|████         | 31/100 [00:00, 286.49it/s, step size=2.48e-02, acc. prob=0.753]
Sample:  60%|███████▊     | 60/100 [00:00, 270.15it/s, step size=3.71e-01, acc. prob=0.917]
Sample: 100%|████████████| 100/100 [00:00, 314.77it/s, step size=3.71e-01, acc. prob=0.925]


Executing: PosteriorPredictive

Executing: ArvizObject
C:\Users\MigueldelaVarga\PycharmProjects\VisualBayesic\venv\lib\site-packages\arviz\data\io_pyro.py:157: UserWarning: Could not get vectorized trace, log_likelihood group will be omitted. Check your model vectorization or set log_likelihood=False
  warnings.warn(
posterior predictive shape not compatible with number of chains and draws.This can mean that some draws or even whole chains are not represented.

Executing: PlotPrior

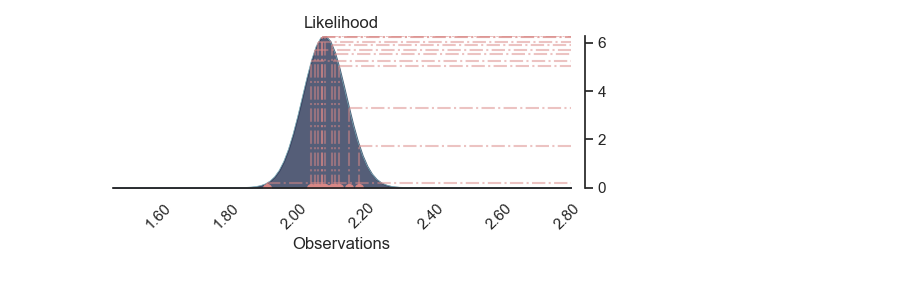
Executing: PlotNormalLikelihood
Setting Backend To: AvailableBackends.numpy

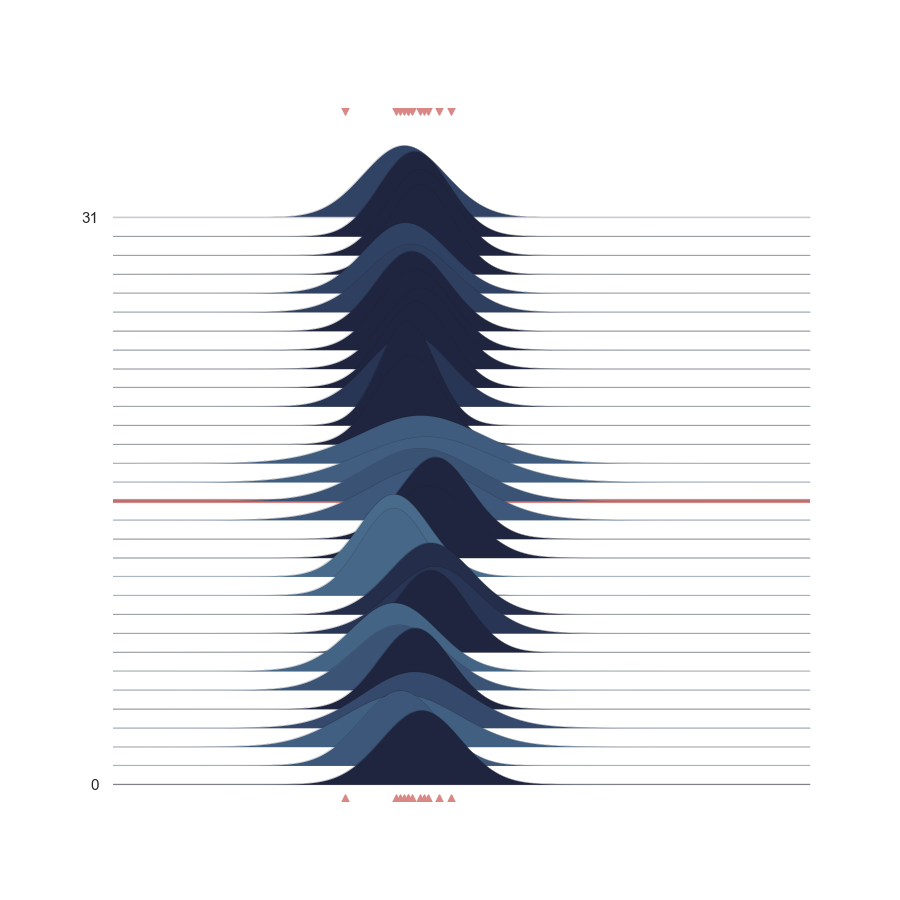
Executing: PlotNormalLikelihoodJoy

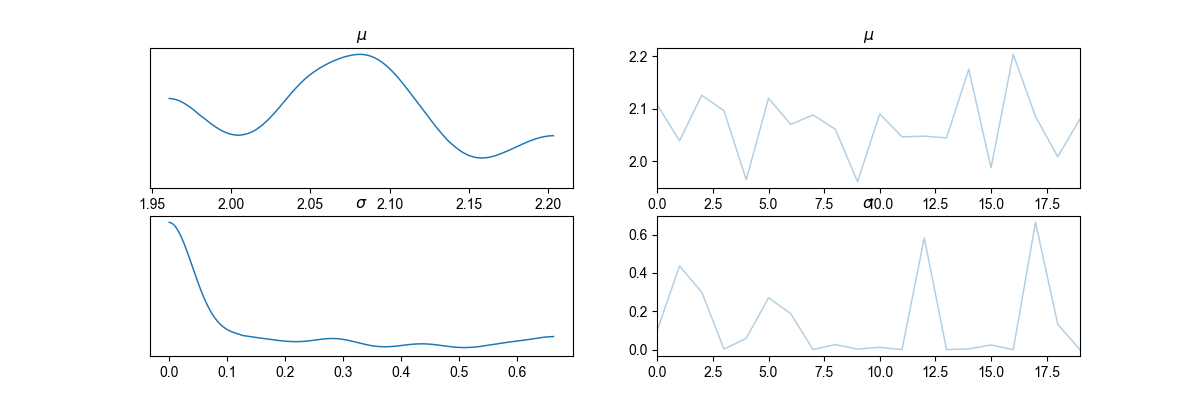
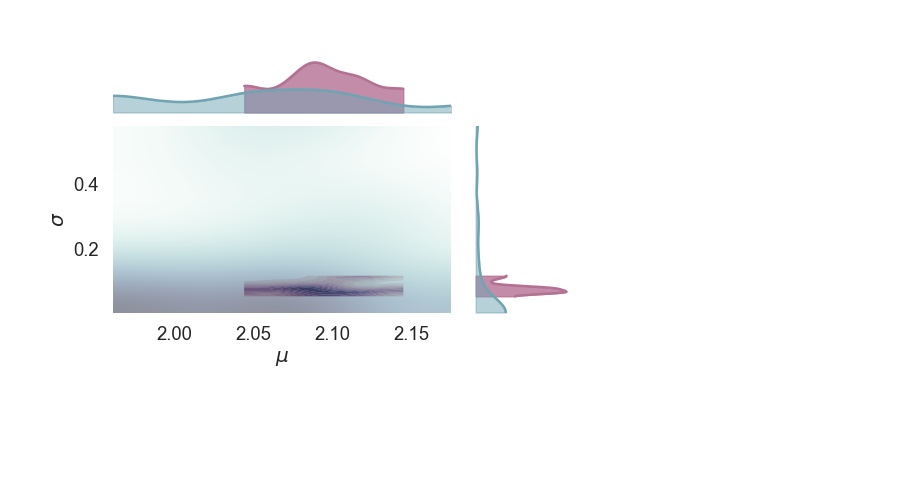
Executing: PlotMarginals

Finished Executing
from argparse import ArgumentParser
from xai_components.base import SubGraphExecutor
from xai_components.xai_controlflow.branches import BranchComponent
from xai_components.xai_obsolete.prob_models import VisualizeModelGraph
from xai_components.xai_plotting.probabilistic_plot import ArvizObject, PlotPrior, PlotNormalLikelihood, PlotMarginals, PlotNormalLikelihoodJoy
from xai_components.xai_probabilistic_models.probabilistic_models_I import PyroModel
from xai_components.xai_probability_distributions.probabilistic_distributions import Gamma, Uniform, Normal
from xai_components.xai_pyro.probabilistic_node import MCMC, RunMCMC, NUTS, PriorPredictive, PosteriorPredictive, Sample

def main(args):
    ctx = {}
    ctx['args'] = args
    c_0 = Normal()
    c_1 = Sample()
    c_2 = PyroModel()
    c_3 = VisualizeModelGraph()
    c_4 = PriorPredictive()
    c_5 = ArvizObject()
    c_6 = PlotPrior()
    c_7 = PlotNormalLikelihood()
    c_8 = PlotNormalLikelihoodJoy()
    c_9 = PosteriorPredictive()
    c_10 = Sample()
    c_11 = Gamma()
    c_12 = PlotMarginals()
    c_13 = Uniform()
    c_14 = BranchComponent()
    c_15 = Sample()
    c_16 = Normal()
    c_17 = Sample()
    c_18 = MCMC()
    c_19 = RunMCMC()
    c_20 = NUTS()
    c_0.mean = c_17.sample
    c_0.std = c_10.sample
    c_1.name.value = '$y$'
    c_1.fn = c_0.fn
    c_1.fn = c_0.fn
    c_1.fn = c_0.fn
    c_1.fn = c_0.fn
    c_1.fn = c_0.fn
    c_1.fn = c_0.fn
    c_1.fn = c_0.fn
    c_1.fn = c_0.fn
    c_1.fn = c_0.fn
    c_1.fn = c_0.fn
    c_1.obs.value = [2.12, 2.06, 2.08, 2.05, 2.08, 2.09, 2.19, 2.07, 2.16, 2.11, 2.13, 1.92]
    c_2.arg1 = c_1.sample
    c_3.model_function = c_2.model
    c_4.model = c_2.model
    c_4.num_samples.value = 20
    c_5.mcmc = c_18.mcmc
    c_5.prior_predictive_values = c_4.prior
    c_5.posterior_predictive_values = c_9.posterior_predictive
    c_6.az_data = c_5.az_data
    c_6.az_data = c_5.az_data
    c_7.az_data = c_5.az_data
    c_7.mean_sample_name.value = '$\\mu$'
    c_7.std_sample_name.value = '$\\sigma$'
    c_7.y_sample_name.value = '$y$'
    c_8.az_data = c_5.az_data
    c_8.mean_sample_name.value = '$\\mu$'
    c_8.std_sample_name.value = '$\\sigma$'
    c_8.y_sample_name.value = '$y$'
    c_9.model = c_2.model
    c_9.MCMC = c_18.mcmc
    c_9.num_samples.value = 20
    c_10.name.value = '$\\sigma$'
    c_10.fn = c_11.fn
    c_10.fn = c_11.fn
    c_11.concentration.value = 0.3
    c_11.rate.value = 3.01
    c_12.az_data = c_5.az_data
    c_12.sample_1_name.value = '$\\mu$'
    c_12.sample_2_name.value = '$\\sigma$'
    c_13.low.value = 0.0
    c_13.high.value = 10.0
    c_14.condition.value = True
    c_15.name.value = '$\\mu$'
    c_15.fn = c_13.fn
    c_15.fn = c_13.fn
    c_15.fn = c_13.fn
    c_15.fn = c_13.fn
    c_15.fn = c_13.fn
    c_15.fn = c_13.fn
    c_15.fn = c_13.fn
    c_15.fn = c_13.fn
    c_15.fn = c_13.fn
    c_15.fn = c_13.fn
    c_15.fn = c_13.fn
    c_15.fn = c_13.fn
    c_16.mean.value = 2.07
    c_16.std.value = 0.07
    c_17.name.value = '$\\mu$'
    c_17.fn = c_16.fn
    c_17.fn = c_16.fn
    c_17.fn = c_16.fn
    c_17.fn = c_16.fn
    c_17.fn = c_16.fn
    c_17.fn = c_16.fn
    c_17.fn = c_16.fn
    c_17.fn = c_16.fn
    c_17.fn = c_16.fn
    c_17.fn = c_16.fn
    c_18.NUTS = c_20.NUTS
    c_18.NUTS = c_20.NUTS
    c_18.num_samples.value = 50
    c_18.num_chains.value = 1
    c_19.mcmc = c_18.mcmc
    c_20.model = c_2.model
    c_0.next = c_1
    c_1.next = c_2
    c_2.next = c_3
    c_3.next = c_4
    c_4.next = c_20
    c_5.next = c_6
    c_6.next = c_7
    c_7.next = c_8
    c_8.next = c_12
    c_9.next = c_5
    c_10.next = c_0
    c_11.next = c_10
    c_12.next = None
    c_13.next = c_15
    c_14.next = c_11
    c_14.when_true = SubGraphExecutor(c_16)
    c_14.when_false = SubGraphExecutor(c_13)
    c_15.next = None
    c_16.next = c_17
    c_17.next = None
    c_18.next = c_19
    c_19.next = c_9
    c_20.next = c_18
    next_component = c_14
    while next_component:
        next_component = next_component.do(ctx)
if __name__ == '__main__':
    parser = ArgumentParser()
    main(parser.parse_args())
    print('\nFinished Executing')
Total running time of the script: (0 minutes 9.945 seconds)
